compare_stat_boxplot.r metadata中变量分组T检验比较并绘制box图
compare_stat_boxplot.r metadata中变量分组T检验比较并绘制box图
使用说明:
metadata中按列分组,做差异比较分析,可以利用 merge_tsv_files.r 或者 merge_metadata_genexpdata.r 将比较的信息合并到metadata中:
usage: /share/nas1/huangls/test/TCGA_immu/scripts/compare_stat_boxplot.r
       [-h] -m filepath -v variate [variate ...] -g group [-b groupby]
       [-G geom] [--addDot] [-p palette [palette ...]] [-T title] [-x xlab]
       [-y ylab] [-o path] [-n prefix] [-H number] [-W number]
box plot and stat :
optional arguments:
  -h, --help            show this help message and exit
  -m filepath, --metadata filepath
                        input metadata file path[required]
  -v variate [variate ...], --variate variate [variate ...]
                        variate for box [required]
  -g group, --group group
                        group name from metadata to test[required]
  -b groupby, --groupby groupby
                        main group name from metadata to subset [default NULL]
  -G geom, --geom geom  set type of plot: boxplot, violin, splitviolin
                        [default=boxplot]
  -p palette [palette ...], --palette palette [palette ...]
                        fill color palette [default ('#e41a1c', '#377eb8',
                        '#4daf4a', '#984ea3', '#ff7f00', '#ffff33', '#a65628',
                        '#f781bf', '#999999')]
  -T title, --title title
                        the label for main title [optional, default: ]
  -x xlab, --xlab xlab  input xlab [default ]
  -y ylab, --ylab ylab  input ylab [default value]
  -o path, --outdir path
                        output file directory [default
                        /share/nas1/huangls/test/TCGA_immu/07.survival]
  -n prefix, --name prefix
                        out file name prefix [default demo]
  -H number, --height number
                        the height of pic inches [default 5]
  -W number, --width number
                        the width of pic inches [default 3]
参数说明:
-m 指定metadata文件
-v 指定要比较的变量所在的列列名,可以多个
-g 指定分组列列名
-G 指定输出 boxplot类型
使用举例:
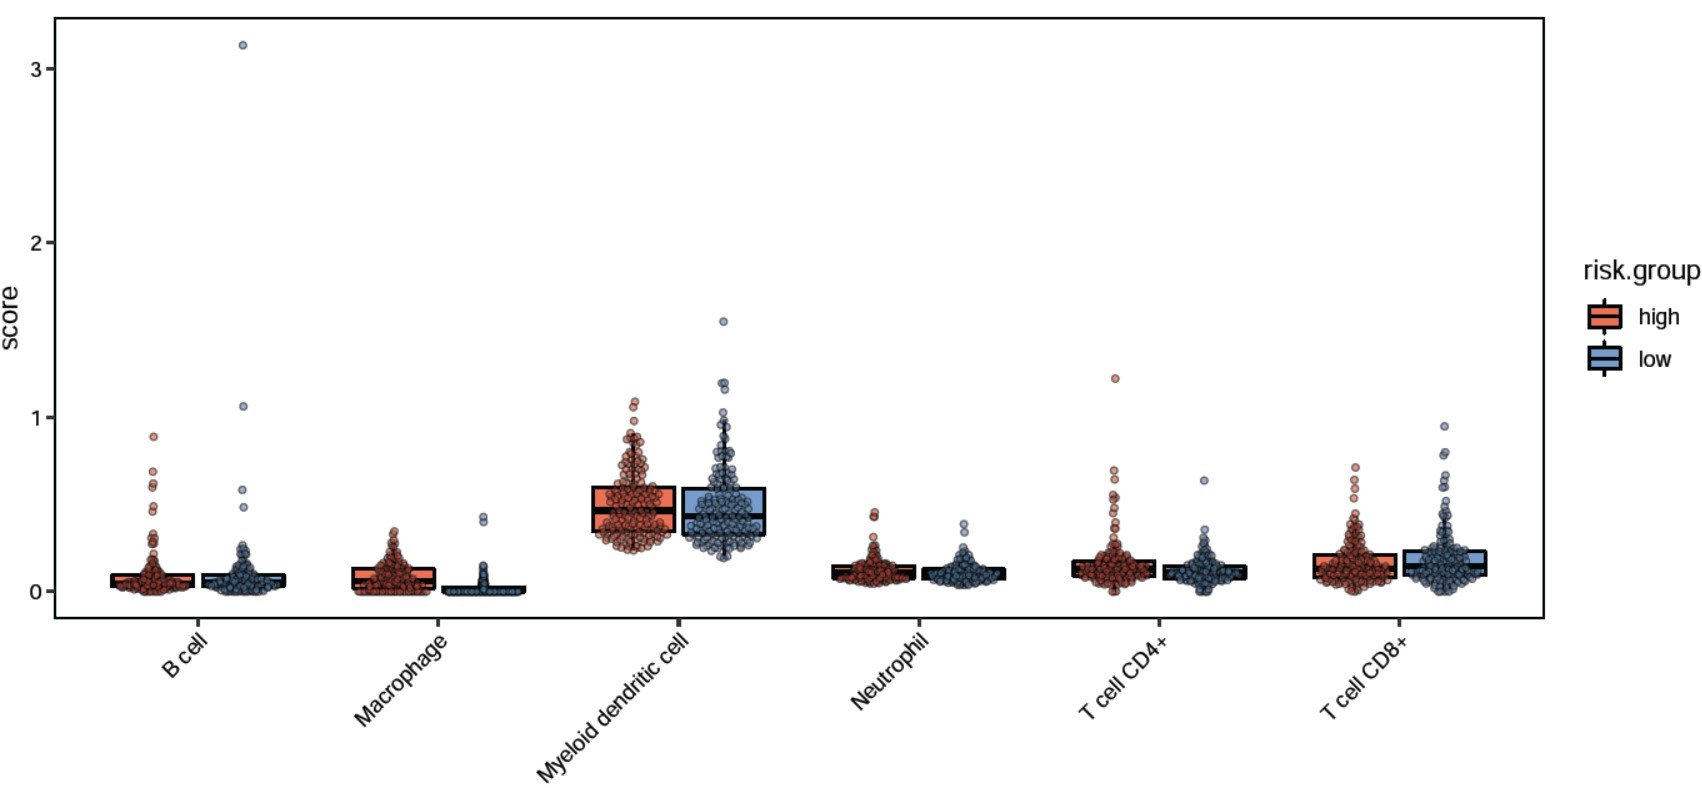
Rscript $scriptdir/compare_stat_boxplot.r -m ../08.Nomogram/nomogram_metadata.tsv \
  -v  PDGFRL CXCR4 PAK3 CSF1R PDCD1 \
  -g risk.group -n signature.geneExp -W 10 -G  boxplot -y "log2(TPM)"
结果输出:
脚本获取与使用课程:https://study.163.com/course/introduction/1211864801.htm?share=1&shareId=1030291076
- 发表于 2021-08-30 17:54
- 阅读 ( 3229 )
- 分类:TCGA
