multi_cox.r 基因表达量做多因素cox分析
multi_cox.r 多因素cox分析
使用方法:
指定多个基因表达量做多因素cox回归分析,并构建预后模型,以及评估预后模型:
$Rscript $scriptdir/multi_cox.r -h

usage: /share/nas1/huangls/test/TCGA_immu/scripts/multi_cox.r
       [-h] -i data -t time -e event -v variate [variate ...]
       [-P predict.time [predict.time ...]] [-c cut.score] [-s seed]
       [-o outdir] [-p prefix]
multi variate cox regression analysis using gene expression
optional arguments:
  -h, --help            show this help message and exit
  -i data, --data data  input data file path[required]
  -t time, --time time  set suvival time column name [required]
  -e event, --event event
                        set event column name must 0 or 1 code format
                        [required]
  -v variate [variate ...], --variate variate [variate ...]
                        variate for cox analysis [required]
  -P predict.time [predict.time ...], --predict.time predict.time [predict.time ...]
                        Time point to draw the ROC curve [default 365 1095
                        1825]
  -c cut.score, --cut.score cut.score
                        set cut score value to divide high and low risk groups
                        [default median]
  -s seed, --seed seed  set random seed [default 2021]
  -o outdir, --outdir outdir
                        output file directory [default cwd]
  -p prefix, --prefix prefix
                        out file name prefix [default cox]
使用举例:
Rscript $scriptdir/multi_cox.r -i imm.unicox.metadata-exp.tsv -e EVENT -t TIME \
    -v PDGFRL CXCR4 PAK3 CSF1R PDCD1 -P  365 1095 1825 \
    -o multicox   -p  multicox
参数说明:
-i 输入生存数据与基因表达文件
| barcode | TIME | EVENT | FGR | CD38 | ITGAL | CX3CL1 | CEACAM21 | MATK | CD79B | MMP25 |
| TCGA-B7-A5TK-01A-12R-A36D-31 | 288 | 0 | 16.34408 | 86.86772 | 40.26903 | 603.0132 | 1.868536 | 2.28342 | 3.453198 | 13.72829 |
| TCGA-BR-7959-01A-11R-2343-13 | 1010 | 0 | 11.96739 | 15.79451 | 7.358566 | 26.91353 | 2.571917 | 0.864116 | 1.879957 | 3.451148 |
| TCGA-IN-8462-01A-11R-2343-13 | 572 | 0 | 5.350846 | 3.111342 | 3.769125 | 20.22238 | 0.610839 | 0.519776 | 2.822192 | 1.106563 |
| TCGA-CG-4443-01A-01R-1157-13 | 912 | 0 | 1.53802 | 0.862955 | 2.37351 | 19.04097 | 1.092127 | 0.760348 | 1.926592 | 0.878735 |
| TCGA-KB-A93J-01A-11R-A39E-31 | 1124 | 0 | 15.24016 | 13.3047 | 38.08591 | 14.15295 | 3.483559 | 3.192951 | 3.651742 | 10.43186 |
| TCGA-HU-A4H3-01A-21R-A251-31 | 882 | 0 | 6.261761 | 2.675173 | 7.025886 | 4.050271 | 0.584159 | 1.039336 | 1.979214 | 2.312993 |
| TCGA-RD-A8MV-01A-11R-A36D-31 | 3720 | 0 | 27.07415 | 20.15885 | 34.91309 | 34.71821 | 4.113112 | 2.615557 | 16.51946 | 17.72674 |
| TCGA-VQ-A91X-01A-12R-A414-31 | 289 | 1 | 1.062341 | 0.752018 | 2.380513 | 4.415815 | 0.518142 | 0.212197 | 1.239203 | 0.582114 |
结果展示:
预后模型构建:
The Risk score was calculated with the following formula: The risk score=
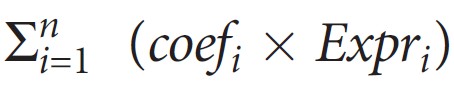
, where Expri represents the expression level of gene i and coefi represents the regression coefficient of gene i in the signature.
风险评分
根据模型计算各样本分风险值,按照风险值的中位数将样本划分为高低风险组,分别绘制风险值分布散点图,生存时间散点图,signature基因表达热图。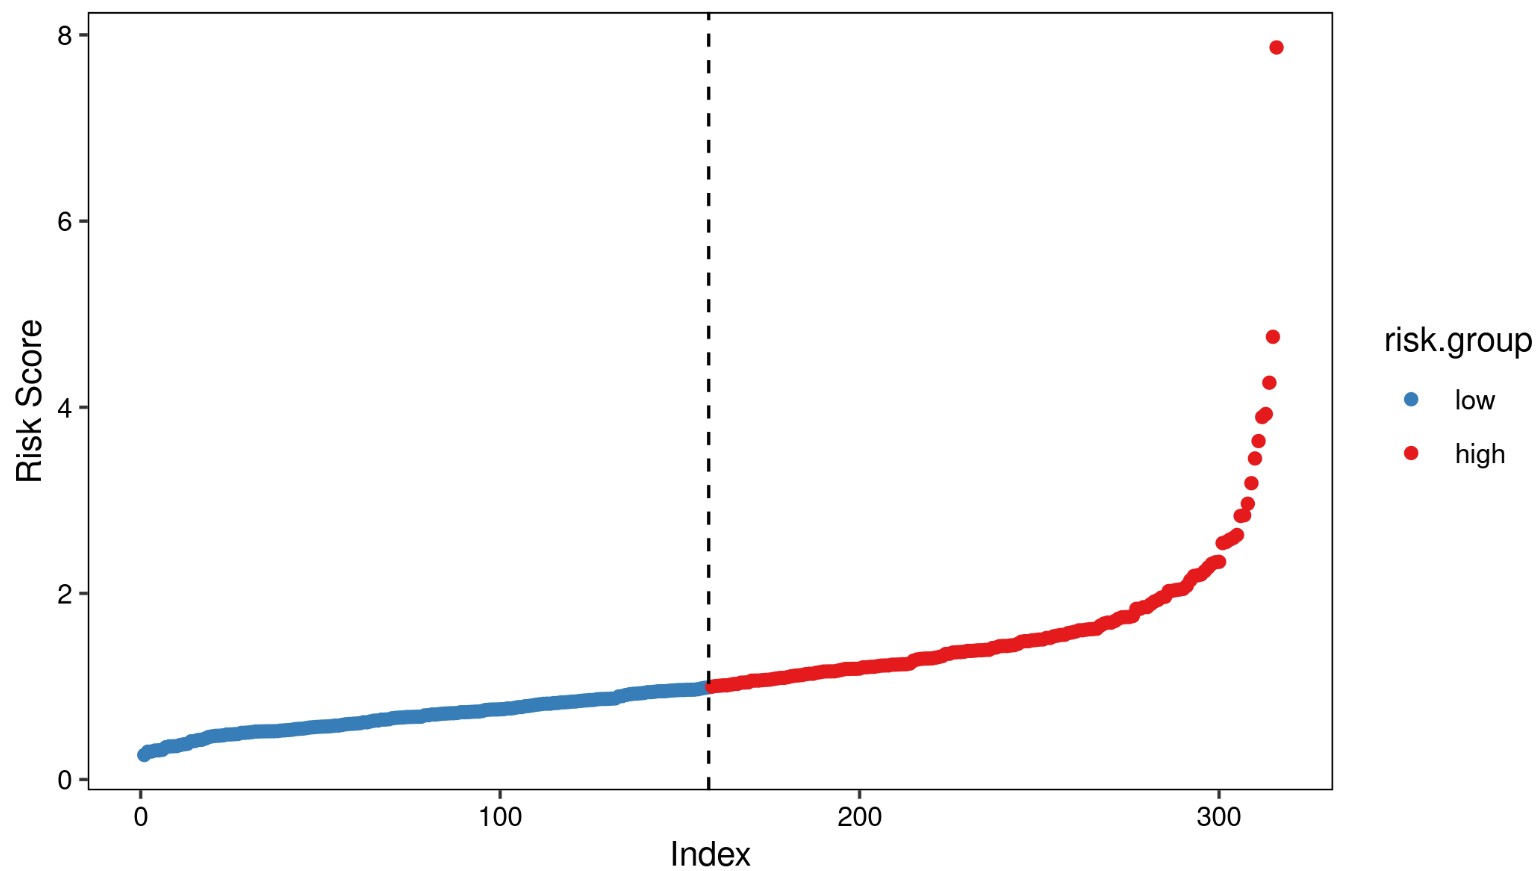
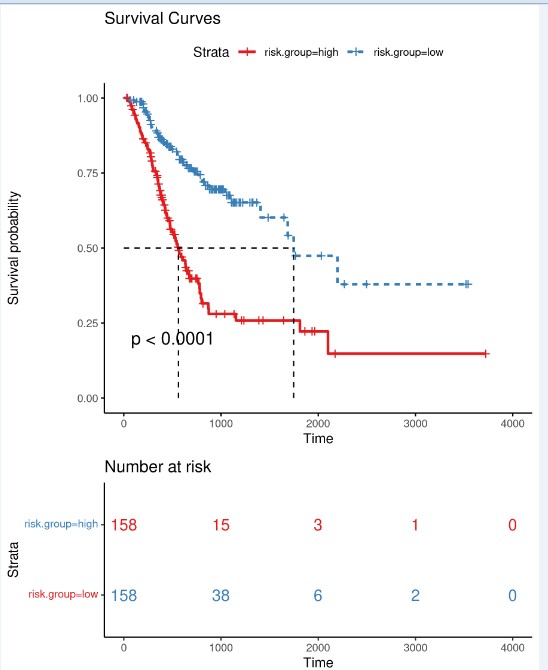
模型预测预后差异
高低风险组预后差异分析:绘制Kaplan-Meier生存曲线,并用Log Rank法检验两组的生存率是否有差异。
模型预测性能评估
模型的好坏可以从区分度(Discrimination)和一致性(Calibration)两方面考虑。区分度主要用于反映预测模型的区分能力,是评估模型有多大把握确定它所预测的患者发生该事件的能力。一致性指结局实际发生的概率和预测的概率的一致性或者接近程度。前者可通过ROC曲线下面积(AUC)或C统计量来评价,后者可通过校准图来评价。以下为模型ROC曲线:
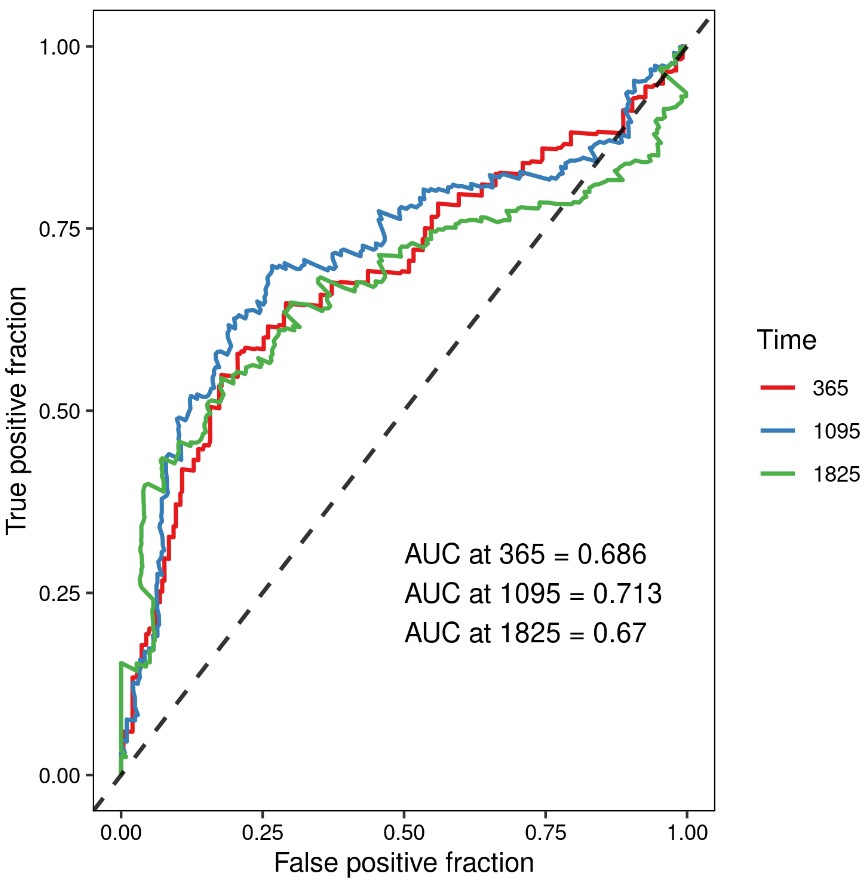
To reflect the prediction ability of the XXXX‐based risk signature, we generated the time-dependent receiver operating characteristic curve (ROC) and calculated the area under the curve (AUC) (R package “survivalROC” ) for 1-year, 3-year, and 5-year overall survival (OS). The Kaplan-Meier, log‐rank, ROC curve, and calibration analyses were all performed and visualized by the “survivalROC”, “rms”, “survival”, and “survminer” packages.
脚本获取与使用课程:https://study.163.com/course/introduction/1211864801.htm?share=1&shareId=1030291076
- 发表于 2021-08-30 16:54
- 阅读 ( 6110 )
- 分类:TCGA
