plot单独画出pheatmap返回的聚类结果(聚类树)
前面两篇文章介绍到pheatmap返回行和列的hclust结果:
pheatmap返回的结果解释(获得新的排序信息) https://www.omicsclass.com/article/507
cutree对pheatmap返回结果实现聚类cluster划分 https://www.omicsclass.com/article/508
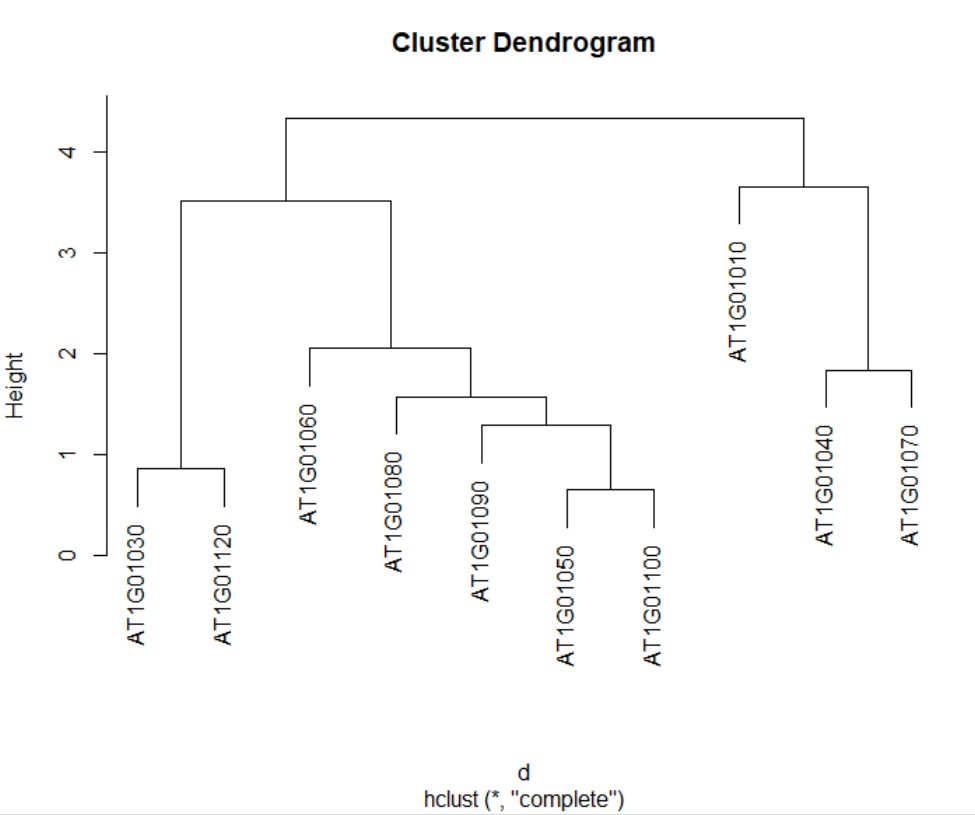
1、按照前两篇文章的基础数据获得的热图结果,对行(基因的聚类结果)聚类树单独进行绘制,可以借助plot()函数:
默认画法
> plot(list$tree_row)
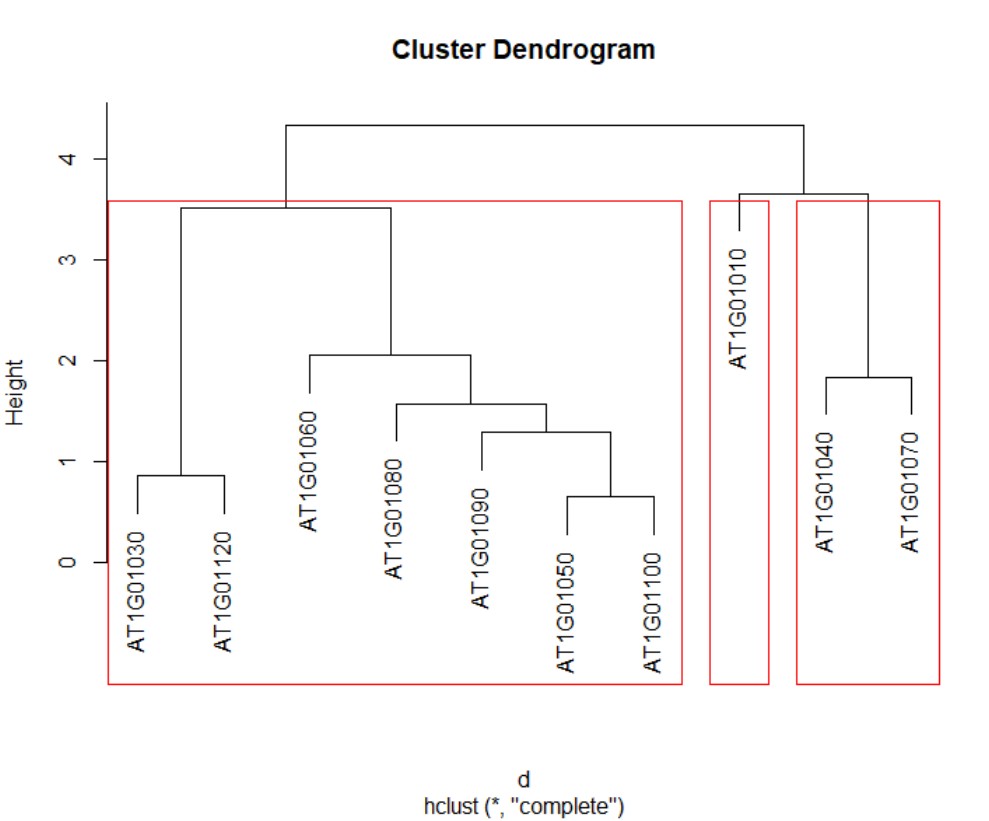
 而有一个有趣的函数rect.hclust()可以将hclust结果绘图,并圈选出不同的cluster,譬如设定3个cluser:
> rect.hclust(list$tree_row,k=3)
得到如下结果:
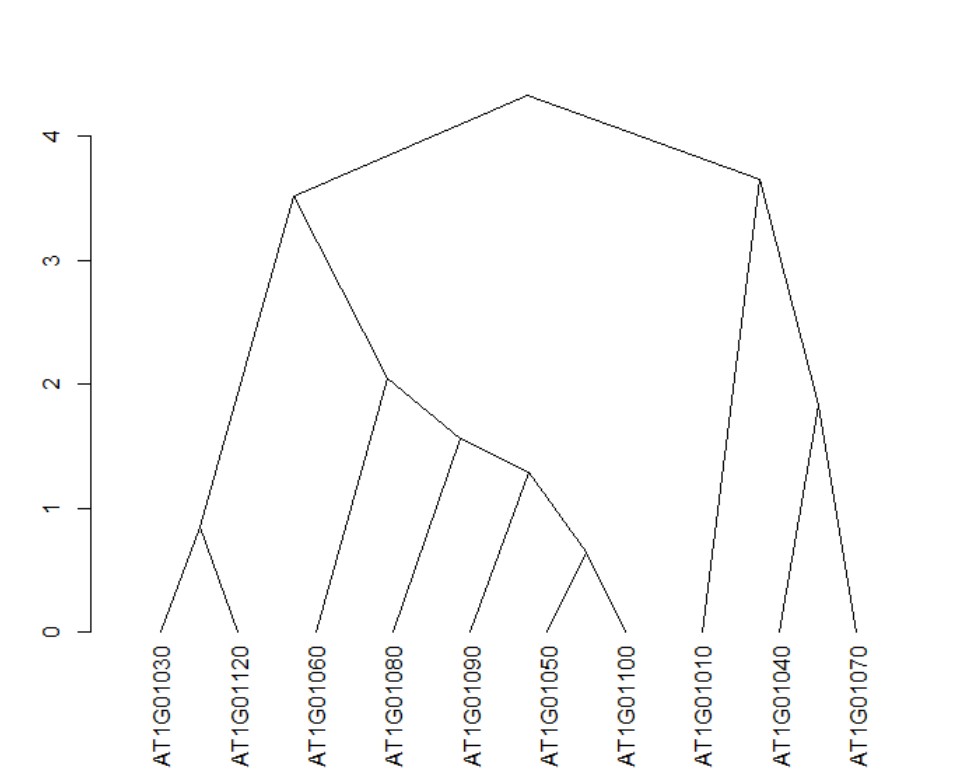
2、而将hclust结果转换成另类树形图as.dendrogram()可以选择type画出其他形状的树形图:
这个树形图一共包含两个type,可以查询?as.dendrogram() 或者?plot.dendrogram得知
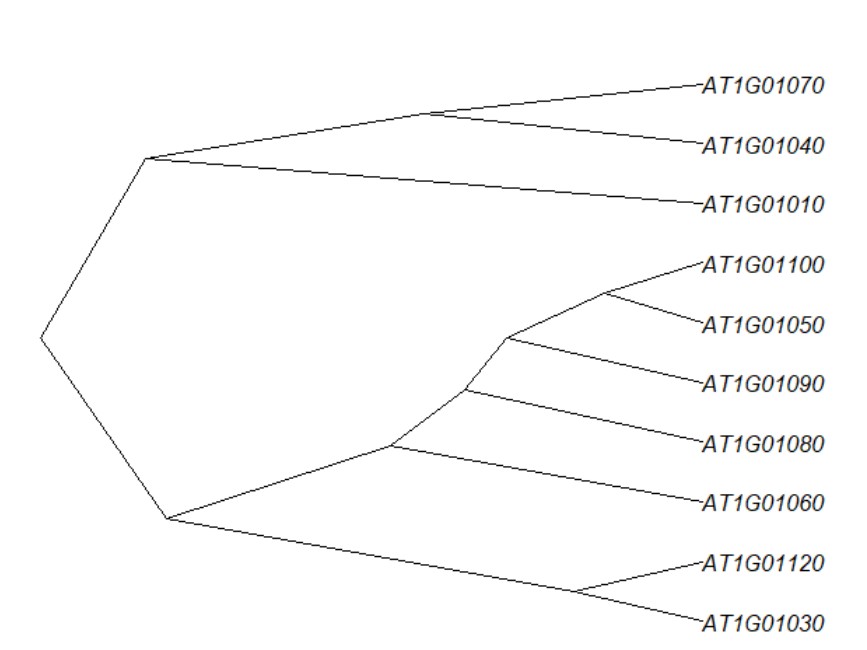
> plot(as.dendrogram(list$tree_row),type = "triangle")
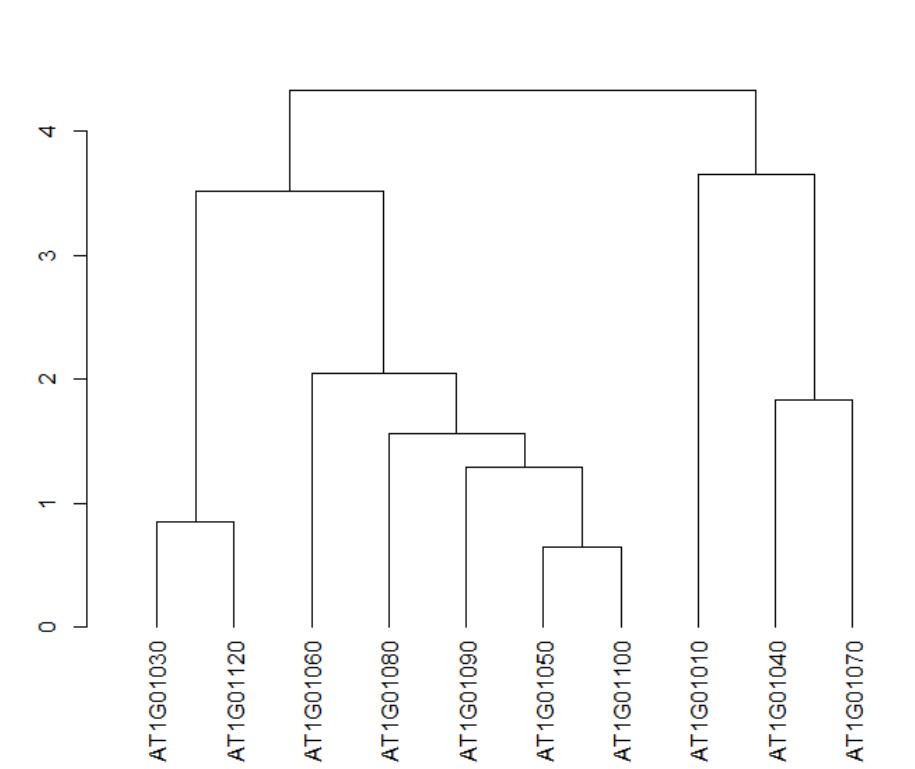
 或者:
或者:
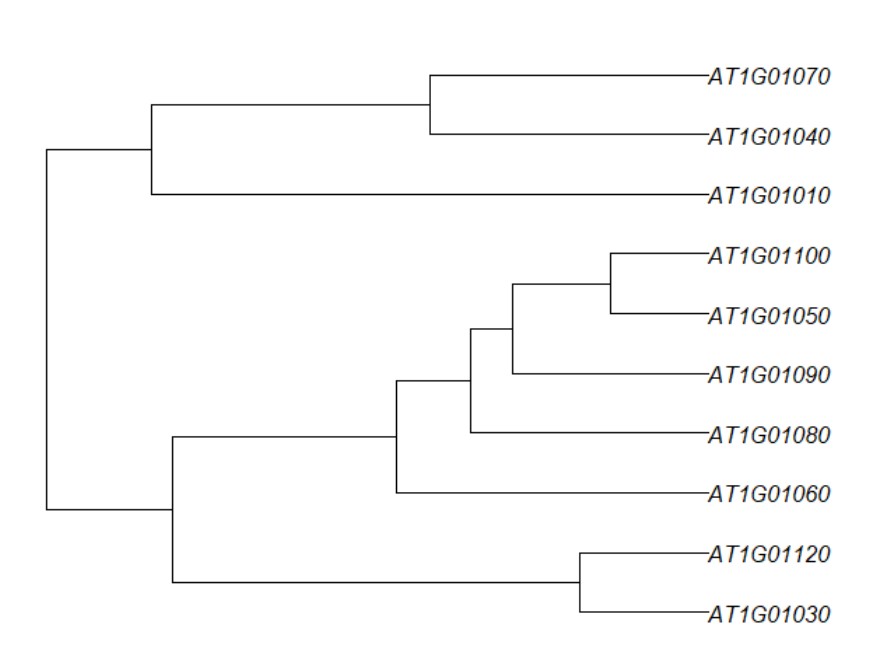
> plot(as.dendrogram(list$tree_row),type = "rectangle")
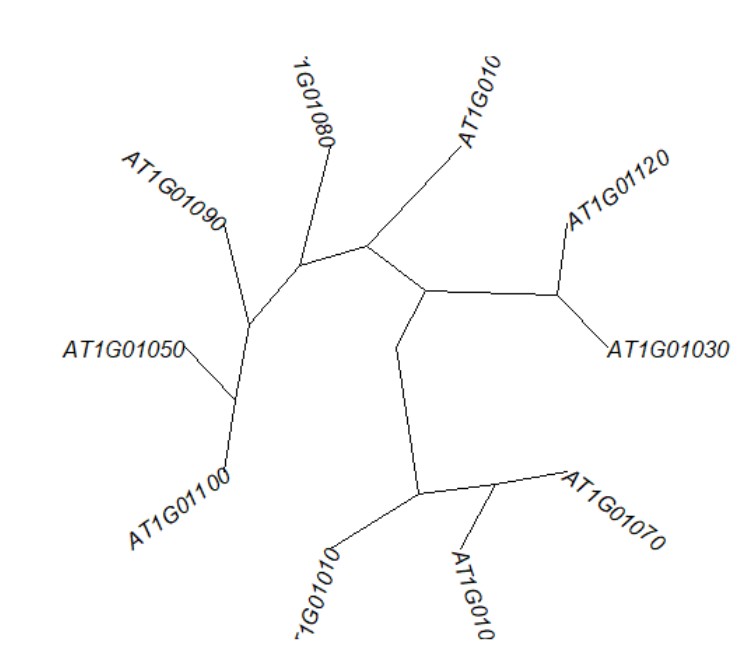
 3、R包ape 中as.phylo(list$tree_row) 可以将hclust返回的结果转化成系统进化树,从而画出新的树形图:
这种树形图画法type很多,可以查询?plot.phylo 获得
默认:
> plot(as.phylo(list$tree_row),type="phylogram")
install.packages("ape")
library(ape)
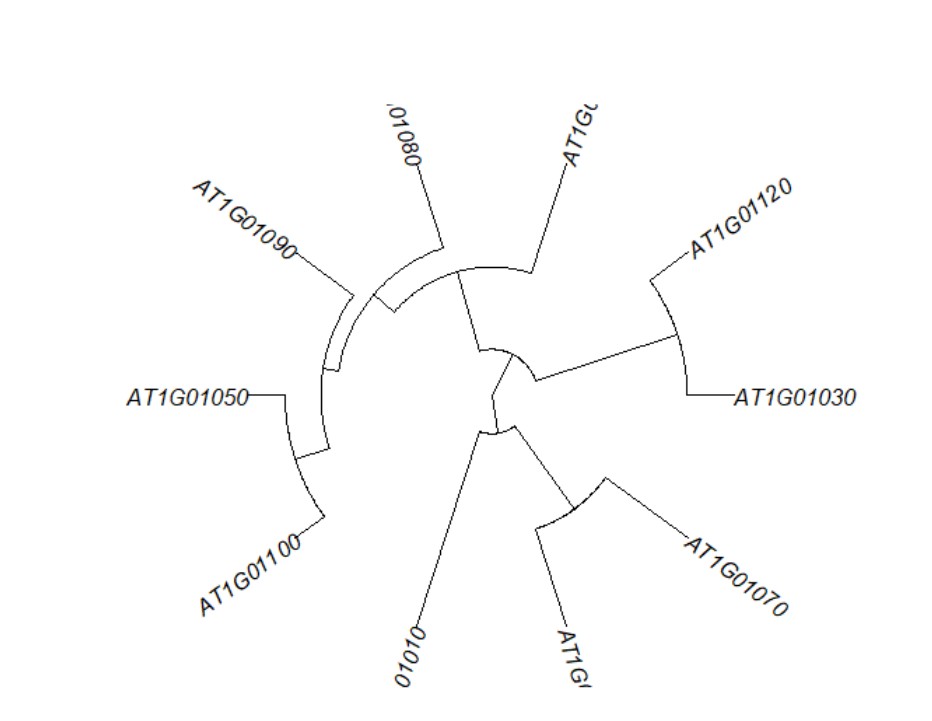
> plot(as.phylo(list$tree_row),type="fan")
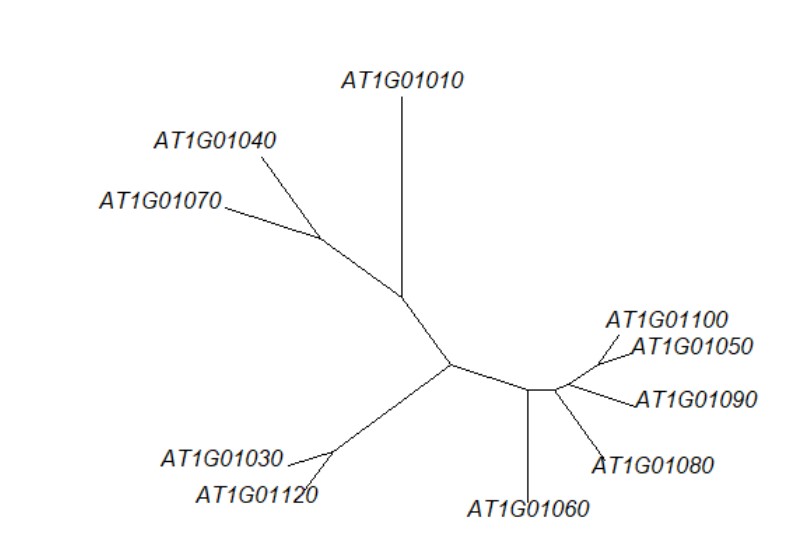
type a character string specifying the type of phylogeny to be drawn; it must be one of "phylogram" (the default), "cladogram", "fan", "unrooted", "radial" or any unambiguous abbreviation of these. cladogram
unrooted
|
……
如果想提升自己的绘图技能,我们推荐:R语言绘图基础(ggplot2)
更多生物信息课程:https://study.omicsclass.com/index
- 发表于 2018-10-19 15:44
- 阅读 ( 9117 )
- 分类:R
