pheatmap返回的结果解释(获得新的排序信息)
pheatmap是一个热图绘制的R包,全称pretty heatmap。利用的绘图函数是pheatmap(),对应的数据则是一个数值矩阵,譬如基于如下的矩阵10X6:
> mat CK-WT-1 CK-WT-2 ...
pheatmap是一个热图绘制的R包,全称pretty heatmap。利用的绘图函数是pheatmap(),对应的数据则是一个数值矩阵,譬如基于如下的矩阵10X6:
> mat
              CK-WT-1      CK-WT-2      CK-WT-3   CK-tdr1-1   CK-tdr1-2   CK-tdr1-3
AT1G01010    3.741490    7.3618000    5.8173400   5.7113100   7.9705400  10.3762000
AT1G01030    5.235280    2.7707000    2.6685900   3.2263200   1.3210500   1.9672600
AT1G01040    2.821317    1.5633947    1.9316282   3.1948090   2.6008540   2.3012776
AT1G01050  118.660000  140.1430000  123.3830000  97.2229000  95.2539000  91.8525000
AT1G01060    1.873769   16.9090246    0.9559375   0.4774184   0.5273923   0.4333881
AT1G01070    1.710346    0.7802436    2.7996091   4.7297117   4.3637146   3.3732144
AT1G01080   30.261105   33.6571056   31.4669073  30.9689028  28.0334025  27.6215018
AT1G01090   86.640500  116.4700000  111.7380000  82.8809000  85.7292000  79.6027000
AT1G01100 1448.627845 1634.0417300 1566.5625600 648.4734402 683.4113500 647.2749880
AT1G01120  173.996000   51.0019000   52.3322000  66.9486000  41.1148000  49.7169000
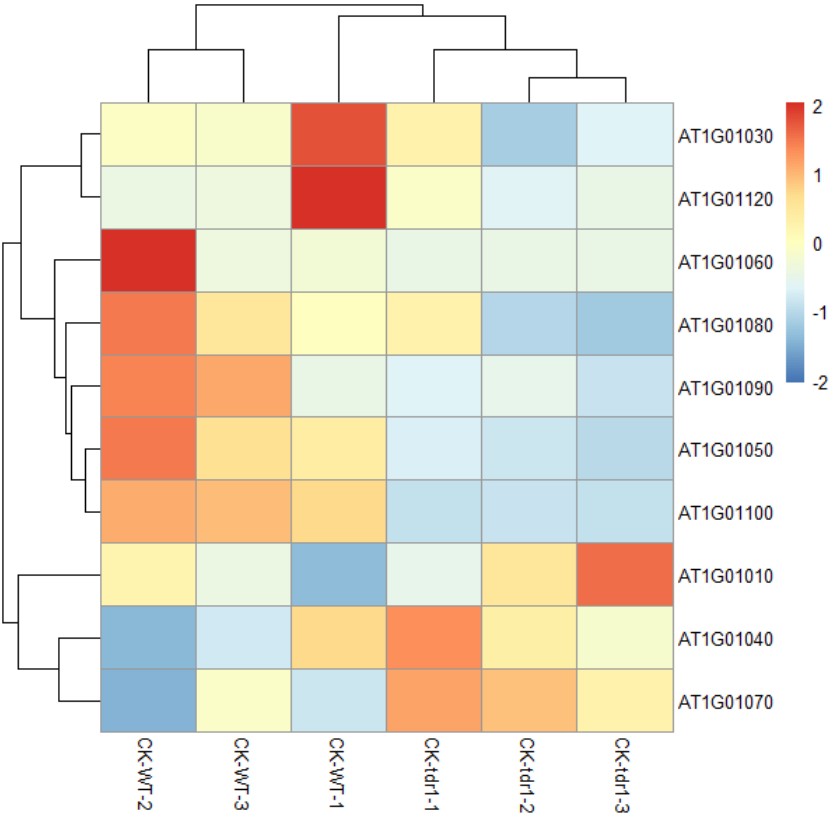
直接按照默认参数绘图获得的结果是返回一张热图:
library(pheatmap)
pheatmap(mat,scale = "row")
 而实际是pheatmap()返回的结果涉及多个:
Value
Invisibly a pheatmap object that is a list with components
tree_row the clustering of rows as hclust object
tree_col the clustering of columns as hclust object
kmeans the kmeans clustering of rows if parameter kmeans_k was specified
gtable a gtable object containing the heatmap, can be used for combining the heatmap with other plots
根据以上的解释,可以知道pheatmap返回的对象是列表,其中包含了多个聚类的结果,其中一个组成结果为行聚类结果,对应的是行基于hclust聚类返回的对象,而hclust返回的对象也是一个列表,包括了多组信息。
以上面的代码为例,将结果赋给一个新的向量,然后查看向量的结果:
list=pheatmap(mat,scale="row")
> summary(list)
         Length Class  Mode
tree_row 7      hclust list
tree_col 7      hclust list
kmeans   1      -none- logical
gtable   6      gtable list
可以看到list$tree_row也是一个列表:
> summary(list$tree_row)
            Length Class  Mode
merge       18     -none- numeric
height       9     -none- numeric
order       10     -none- numeric
labels      10     -none- character
method       1     -none- character
call         3     -none- call
dist.method  1     -none- character
> list$tree_row$order
 [1]  2 10  5  7  8  4  9  1  3  6
而其中有一个重要的内容是order,他是进行行聚类重排后的排列顺序,基于这个信息可以输出排序后的矩阵,从而获得与热图显示顺序一致的文件结果:
> newOrder=mat[list$tree_row$order,]
> newOrder
              CK-WT-1      CK-WT-2      CK-WT-3   CK-tdr1-1   CK-tdr1-2   CK-tdr1-3
AT1G01030    5.235280    2.7707000    2.6685900   3.2263200   1.3210500   1.9672600
AT1G01120  173.996000   51.0019000   52.3322000  66.9486000  41.1148000  49.7169000
AT1G01060    1.873769   16.9090246    0.9559375   0.4774184   0.5273923   0.4333881
AT1G01080   30.261105   33.6571056   31.4669073  30.9689028  28.0334025  27.6215018
AT1G01090   86.640500  116.4700000  111.7380000  82.8809000  85.7292000  79.6027000
AT1G01050  118.660000  140.1430000  123.3830000  97.2229000  95.2539000  91.8525000
AT1G01100 1448.627845 1634.0417300 1566.5625600 648.4734402 683.4113500 647.2749880
AT1G01010    3.741490    7.3618000    5.8173400   5.7113100   7.9705400  10.3762000
AT1G01040    2.821317    1.5633947    1.9316282   3.1948090   2.6008540   2.3012776
AT1G01070    1.710346    0.7802436    2.7996091   4.7297117   4.3637146   3.3732144
如果想提升自己的绘图技能,我们推荐:R语言绘图基础(ggplot2)
更多生物信息课程:https://study.omicsclass.com/index
- 发表于 2018-10-19 14:23
- 阅读 ( 12653 )
- 分类:R
