exp_immu_cor_plot.r 基因表达量与免疫侵润相关性绘图分析
exp_immu_cor_plot.r 基因表达量与免疫侵润相关性绘图分析
使用方法:
$Rscript ../scripts/exp_immu_cor_plot.r -h

usage: ../scripts/exp_immu_cor_plot.r [-h] -e expset -i immu [-m method]
                                      [-a alternative] [-n ncol] [-l]
                                      [-x label.x.npc] [-y label.y.npc]
                                      [-o outdir] [-H height] [-W width]

scattor correlateion plot: https://www.omicsclass.com/article/1488

optional arguments:
  -h, --help            show this help message and exit
  -e expset, --expset expset
                        set event column name [required]
  -i immu, --immu immu  input data file path[required]
  -m method, --method method
                        a character string indicating which correlation
                        coefficient (or covariance) is to be computed. One of
                        "pearson", "kendall", or "spearman". [default pearson]
  -a alternative, --alternative alternative
                        a character string specifying the alternative
                        hypothesis, must be one of "two.sided" , "greater" or
                        "less". You can specify just the initial letter.
                        [default two.sided]
  -n ncol, --ncol ncol  column num [default [default 4]
  -l, --log2            Whether to do log2 transformation of gene expression
                        [default FALSE]
  -x label.x.npc, --label.x.npc label.x.npc
                        value should be between 0 and 1. Coordinates to be
                        used for positioning the label, expressed in
                        "normalized parent coordinates". [default 0]
  -y label.y.npc, --label.y.npc label.y.npc
                        value should be between 0 and 1. Coordinates to be
                        used for positioning the label, expressed in
                        "normalized parent coordinates". [default 1]
  -o outdir, --outdir outdir
                        output file directory [default cwd]
  -H height, --height height
                        the height of pic inches [default 5]
  -W width, --width width
                        the width of pic inches [default 10]
使用举例:
Rscript ../scripts/exp_immu_cor_plot.r -e gene_exp1.tsv -i ../03.TIME/immu/timer.res.tsv -o timer_cor1 --log2
参数说明:
-e 指定输入指定基因的表达量,行为 基因,列为样本名称
| ID | TCGA-D7-A74A-01A-11R-A32D-31 | TCGA-BR-7704-01A-11R-2055-13 | TCGA-VQ-A91N-01A-11R-A414-31 | TCGA-CD-A4MH-01A-11R-A251-31 |
| NUP50 | 18.65505 | 31.59232 | 28.23382 | 28.76485 |
| CXCR4 | 64.85805 | 125.123 | 56.35244 | 69.98976 |
| NT5E | 111.4818 | 69.8587 | 79.37382 | 25.05824 |
| EFNA3 | 8.247857 | 42.03308 | 43.46432 | 26.66024 |
| STC1 | 4.781111 | 21.36327 | 40.81077 | 19.51568 |
| ZBTB7A | 95.51678 | 103.4768 | 158.3024 | 126.2677 |
| CLDN9 | 1.187456 | 2.476138 | 0.366081 | 7.347344 |
-i 输入样本免疫侵润结果, 注意脚本会自动对两个文件里的样本取交集
| cell_type | TCGA-B7-A5TK-01A-12R-A36D-31 | TCGA-BR-7959-01A-11R-2343-13 | TCGA-IN-8462-01A-11R-2343-13 | TCGA-BR-A4CR-01A-11R-A24K-31 |
| B cell | 0 | 0.013159742 | 0.000907507 | 0.020234 |
| T cell CD4+ | 0 | 0.114882797 | 0.118061151 | 0.152274 |
| T cell CD8+ | 0.771121767 | 0.130798349 | 0.048964712 | 0.005392 |
| Neutrophil | 0.22692792 | 0.125194736 | 0.106562343 | 0.057013 |
| Macrophage | 0 | 0.213365358 | 0 | 0.05444 |
| Myeloid dendritic cell | 0.935644191 | 0.457844399 | 0.404774813 | 0.296719 |
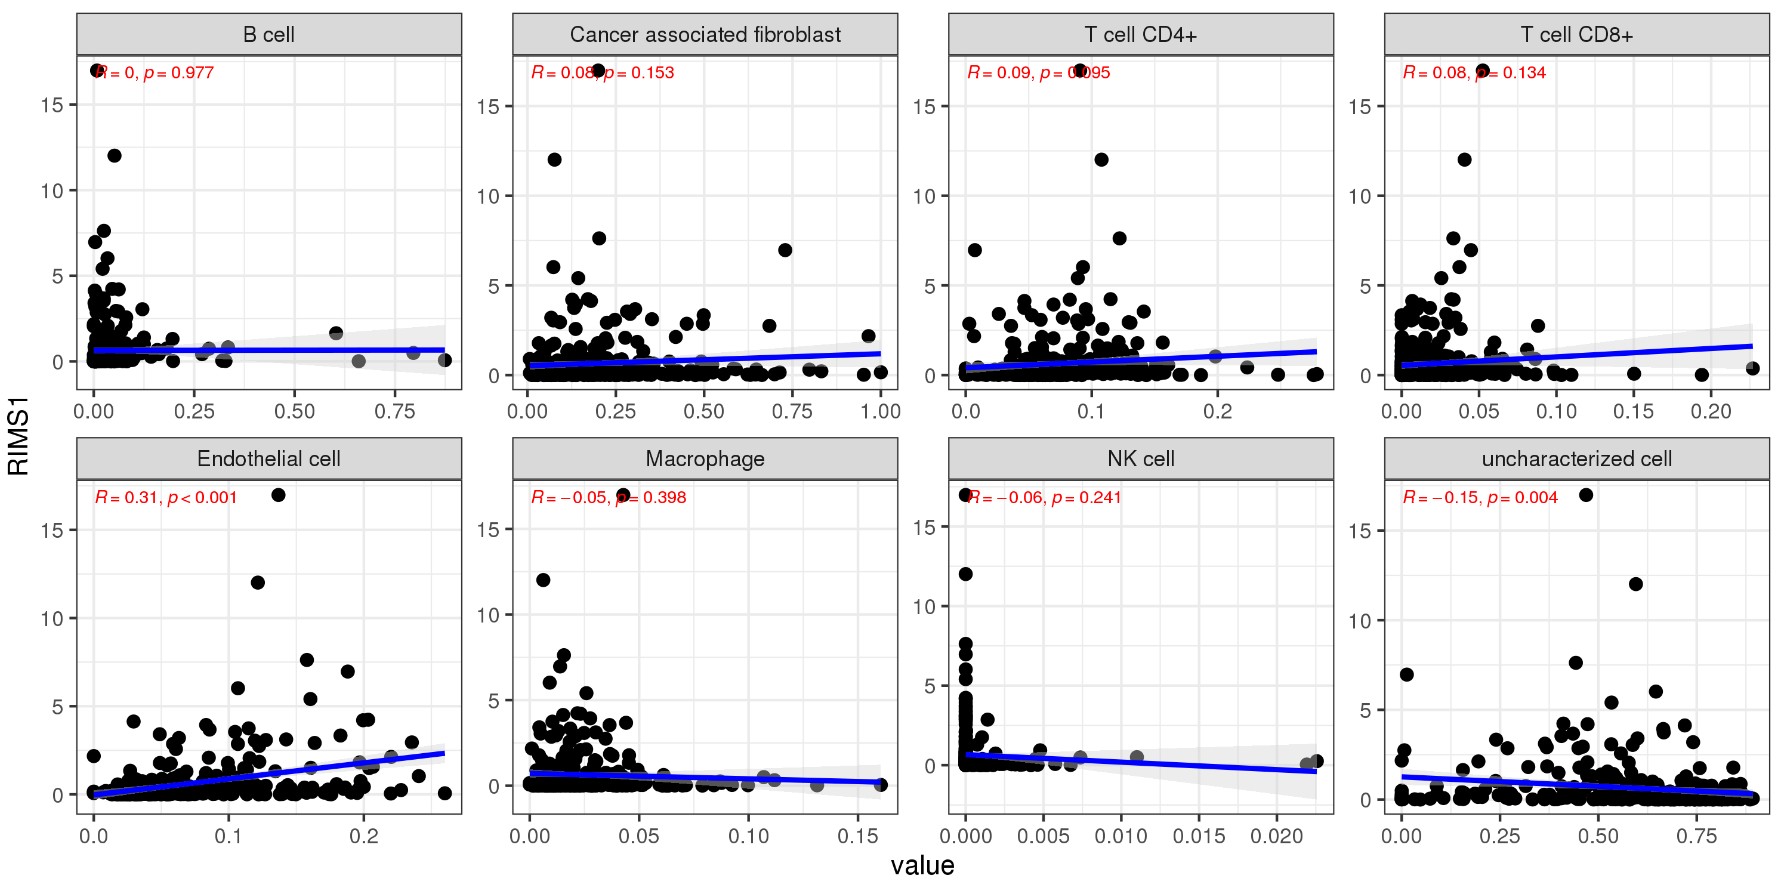
绘图输出结果:
- 发表于 2021-06-15 14:33
- 阅读 ( 3864 )
- 分类:TCGA
