如何用R语言绘制进化树+热图
除了用在线网站-iTQL给进化树加热图,还可以用R语言来进行绘制!
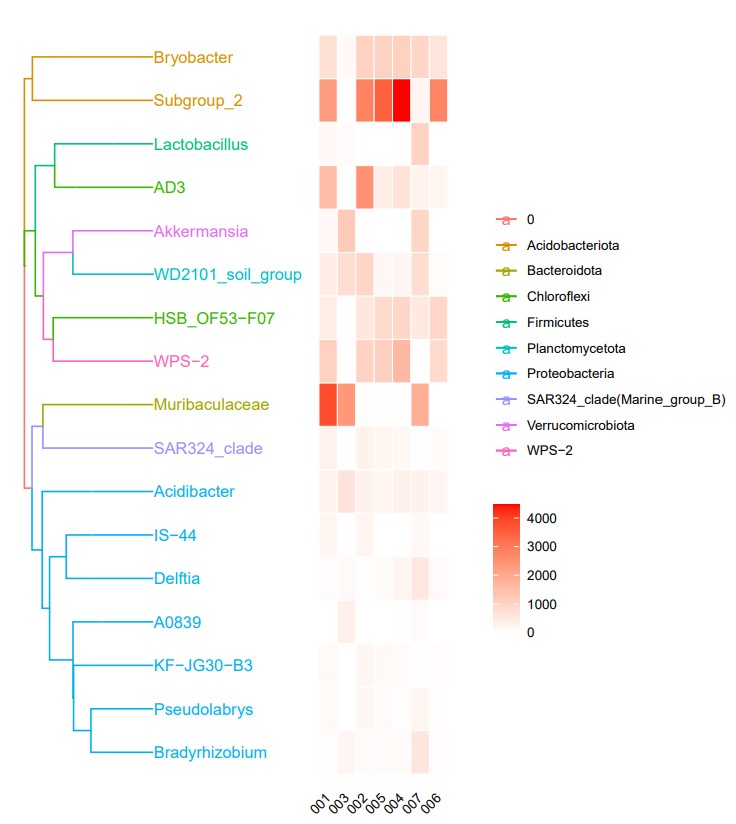
系统进化树:也叫作聚类树或者进化树,是生物信息学中描述不同生物之间的相关关系的方法。
作用:通过绘制进化树分析可以了解所有生物的进化历史过程系统发育树的主要构成、找出不同物种间的进化关系、理解祖先序列与其后代之间的关系、估算一组共有共同祖先的物种间的分歧时间等等。
一、准备文件:
- 树文件:nwk格式:tree.nwk
- 脚本:tree_heatmap_plot.r
脚本代码:
#!/usr/bin/env Rscript
library(getopt)
library(ggtree)
library(EBImage)
library(ggplot2)
library(stringr)
library(reshape2)

spec <- matrix(c(
                                'help', 'h', 0, "logical", "help print",
                                'tree', 'i', 1, "character", "input file tree.nwk, required.",
                                'tax', 't', 1, "character", "input file heatmap , required.",
                                'height' , 'H', 1, "integer","the height of graph ,unit is inches [optional, default: 8]",
                                'width' , 'W', 1, "integer","the width of graph ,unit is inches [optional, default: 6]",
                                'outdir', 'o', 1, "character", "output directory for pic file, [optional, default: cwd]",
                                'name', 'n', 1, "character", "output file name prefix, [optional, default: tree_heatmap_plot]"
                ), byrow = TRUE, ncol = 5)

opt <- getopt(spec)
if ( !is.null(opt$help) | is.null(opt$tree) | is.null(opt$tax)) {
        cat(getopt(spec, usage=TRUE))
        q(status=1)
}

tree <-read.tree(opt$tree)
tax <- read.table(opt$tax,row.names = 1,header = TRUE,check.names = FALSE,sep = "\t")

groupInfo <- split(row.names(tax),tax$phylum)
tree2 <- groupOTU(tree,groupInfo)
tax_p <- tax[,-1]

p <- ggtree(tree2,aes(color=group),right = TRUE)+theme(legend.position= "right")+geom_tiplab(align=TRUE,linetype = "solid")#linetype线条类型,dotted点线;solid实线;
p1 <- gheatmap(p,tax_p,
                offset=1,    #offset设置两者间距,用于解决图重叠问题;
                font.size=3,    #font.size设置热图文字大小,解决文字过大重叠;
                low="white",    #最低值颜色
                high="red",    #最高值颜色
                width = 1,    #width设置热图相对树图的宽度,解决热图和树图大小关系;
                colnames_position = "bottom",    #热图文字文字位置
                colnames_angle=45,    #调节热图角度
                hjust =1,    #调整热图标签位置,解决文字与热图重叠问题。
                )

pdf(file=paste(opt$outdir,"/",opt$name,".pdf",sep=""), height=opt$height, width=opt$width)
print(p1)
dev.off()
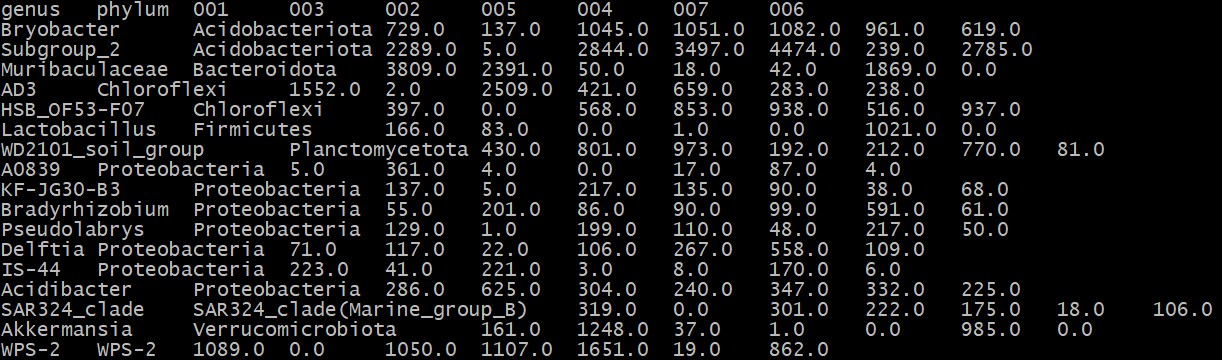
3.热图文件:my_tax.txt
文件格式:第一列是OTU属的名称、第二列为门水平的名称、其他列表示不同的分组,注意文件第一列和进化树的名称对应。
运行代码:
Rscript tree_heatmap_plot.r -i tree.nwk -t my_tax.txt -n phylogenetic_heatmap_plot -H 8 -W 6 -o phylogenetic
参数说明:
-i 加树文件
-t 加热图文件
-n 绘图名称
-H 设置图片高度
-W设置图片宽度
-o 输出目录
结果:
- 发表于 2021-02-22 15:56
- 阅读 ( 12293 )
- 分类:R
