如何绘制SNP密度图
如何绘制SNP密度图
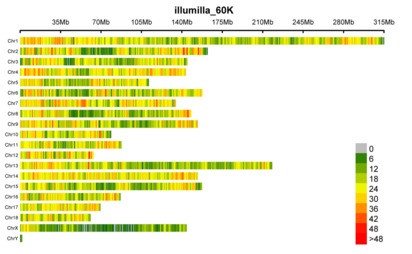
高通量测序横行的时代,主角分子标记也从SSR变成了SNP;无论是重测序还是转录组都会生成SNP信息,下面,小编教你画一个高逼格的SNP标记在不同的染色体的分布密度图(如下图所示):
该图使用 CMplot 包来绘制,不过需要用到R语言,想学习R语言的小伙伴可以参考课程:《R语言快速入门》(点击蓝色字链接)。
下面小编就将绘制SNP密度图用的R语言脚本分享给大家,希望对您的学习带来帮助!
CMplot 包链接:https://github.com/YinLiLin/R-CMplot
脚本运行示例:
Rscript snp.density.map.R -i snp.vcf -n out -s 1000000 -c "darkgreen,yellow,red"
-i :跟输入文件,格式为vcf文件;
-n :设置输出文件名称前缀,文件输出到当前目录下;
-s :设置窗口大小;
-c :设置颜色梯度,可以设置一到多种颜色,建议设置两种或三种颜色,颜色间以 "," 分隔。
代码如下:
#北京组学生物科技有限公司
#email: wangq@biomics.com.cn

source("https://raw.githubusercontent.com/YinLiLin/CMplot/master/R/CMplot.r")
library(getopt)
#+--------------------
# get options
#+--------------------
spec <- matrix(c(
  'help', 'h', 0, "logical", "help",
  'binsize', 's', 1, "integer", "the size of bin for SNP_density plot, optional.",
  'color', 'c', 1, "character", " the colour for the SNP density, separated by ',', optional.",
  'name', 'n', 1, "character", "add a character to the output file name, optional.",
  'input', 'i', 1, "character", "vcf input file, forced."
), byrow = TRUE, ncol = 5)

opt <- getopt(spec)

#+--------------------
# check options
#+--------------------
if ( !is.null(opt$help) | is.null(opt$input) ) {
  cat(getopt(spec, usage=TRUE))
  q(status=1)
}
if ( is.null(opt$binsize ) )            { opt$binsize = 1e6 }
if ( is.null(opt$color ) )              { opt$color = "yellow,red" }
if ( is.null(opt$name ) )               { opt$name = "Fig1" }

#data(pig60K)
data <- read.table(opt$input, comment.char = "#", header = F, blank.lines.skip = T)
num <- dim(data)[1]
name <- paste("A", 1:num, sep = "")
snp <- data.frame(name,data[1],data[2])
colnames(snp) = c("SNP","Chromosome","Position")
color <- unlist(strsplit( opt$color, split = ","))

CMplot(
  snp, plot.type="d",  bin.size=opt$binsize, col=color, xlab = "SNP",
  file="jpg", dpi=300, memo=opt$name, file.output=TRUE, verbose=TRUE
)
CMplot(
  snp, plot.type="d",  bin.size=opt$binsize, col=color,
  file="pdf", memo=opt$name, file.output=TRUE, verbose=TRUE
)
好了,你也赶快动手试一试吧!
最后祝您科研愉快!
此外,我们在网易云课堂上有各种教学视频,有兴趣可以了解一下:
1. 文章越来越难发?是你没发现新思路,基因家族分析发2-4分文章简单快速,学习链接:基因家族分析实操课程
2. 转录组数据理解不深入?图表看不懂?点击链接学习深入解读数据结果文件,学习链接:转录组(有参)结果解读;转录组(无参)结果解读
3. 转录组数据深入挖掘技能-WGCNA,提升你的文章档次,学习链接:WGCNA-加权基因共表达网络分析
4. 转录组数据怎么挖掘?学习链接:转录组标准分析后的数据挖掘
6. 更多学习内容:linux、perl、R语言画图,更多免费课程请点击以下链接:
- 发表于 2019-03-29 13:16
- 阅读 ( 13268 )
- 分类:R
