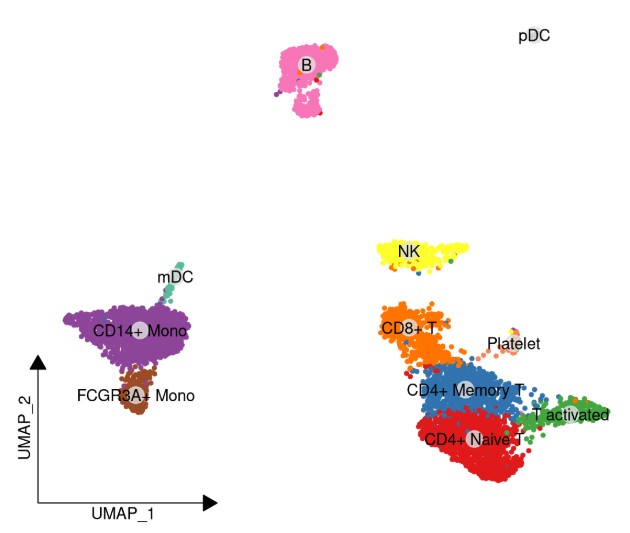
手动绘制dimplot
#指定细胞类型顺序
#as.character(unique(obj$mycelltype))
cluster_order <- c("CD4+ Naive T","CD4+ Memory T","T activated", "CD14+ Mono" , "CD8+ T" , "NK" , "FCGR3A+ Mono", "B" , "pDC" , "mDC" , "Platelet" )
#提取坐标和注释数据
df <- tibble(
UMAP_1 = as.data.frame(obj@reductions$umap@cell.embeddings)$umap_1,
UMAP_2 = as.data.frame(obj@reductions$umap@cell.embeddings)$umap_2,
cluster = factor(obj@meta.data$mycelltype,levels =cluster_order,ordered = T ))
#获取细胞亚群Umap的中心点
df_center <- df %>%
group_by(cluster) %>%
summarise(x = median(UMAP_1), y = median(UMAP_2))
#ggplot散点图绘制
ggplot(df) +
geom_point(size = 1,aes(UMAP_1, UMAP_2, color = cluster)) +
geom_point(size = 5,
data = df_center,
mapping = aes(x, y),
color="grey90",
alpha = 0.8)+
geom_text(data = df_center,
mapping = aes(x, y, label = cluster),
color='black')+
scale_color_manual(values = color_palette)+
theme_dr()+
theme(panel.grid.major = element_blank(),
panel.grid.minor = element_blank(),
panel.background = element_blank())+
NoLegend()
- 发表于 2026-04-08 17:02
- 阅读 ( 432 )
- 分类:转录组
