boxplot绘图分面
df=read.table("~/LUAD/data/TCGA/metadataAll.group.tsv",sep="\t",header=T,check.names = F)
df=df[,!duplicated(colnames(df))]
# "Cisplatin_1005" \
# "Gemcitabine_1190" \
# "Docetaxel_1007" \
# "Paclitaxel_1080" \
# "Irinotecan_1088" "Vinorelbine_2048" "Osimertinib_1919" \
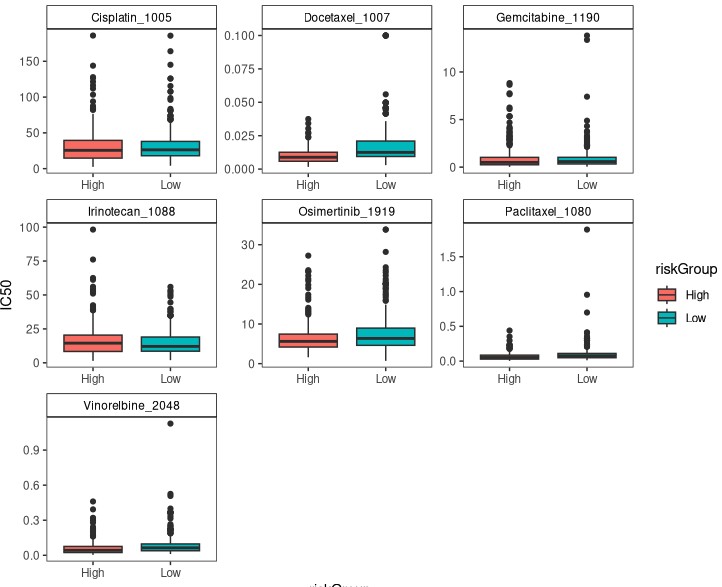
df=df[,c("Cisplatin_1005","Gemcitabine_1190","Docetaxel_1007","Paclitaxel_1080","Irinotecan_1088","Vinorelbine_2048","Osimertinib_1919","riskGroup")]
library(dplyr)
#长型数据转换
score=df %>%
pivot_longer(cols = -riskGroup, names_to = "Drug", values_to = "IC50")
ggplot(subset(score,IC50<200), aes(x = riskGroup, y = IC50, fill = riskGroup)) +
geom_boxplot()+
#geom_jitter(width = 0.1,alpha = 0.3) +
facet_wrap(~Drug, scales = "free") +
theme_bw()+theme(
panel.grid.major = element_blank(),
panel.grid.minor = element_blank(),
strip.background = element_rect(fill = "white", colour = "black"), # 设置小图标题背景为白色
strip.text = element_text(colour = "black") # 设置标题文字颜色为黑色(可选)
)
- 发表于 2026-03-02 11:32
- 阅读 ( 543 )
- 分类:转录组
