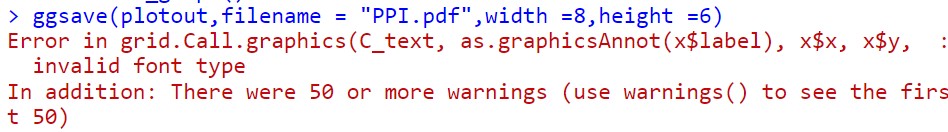
R语言使用ggraph绘图导出pdf报错——“invalid font type”
使用ggraph绘图,在结果导出pdf的时候报错,不可用的字体类型“invalid font type”
如果继续使用ggsave导出,可以直接载入字体:
library(showtext)
font_add('Times','/Library/Fonts/T...
使用ggraph绘图,在结果导出pdf的时候报错,不可用的字体类型“invalid font type”
如果继续使用ggsave导出,可以直接载入字体:
library(showtext)
font_add('Times','/Library/Fonts/Times.ttf')
showtext_auto() #调用showtext使其能够在ggsave()中使用
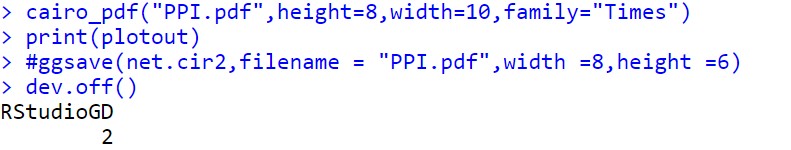
或者可以选择使用cairo_*函数进行结果图片的导出:
plotout<-ggraph(layout) +
  coord_fixed()+
  theme_graph()
#ggsave(plotout,filename = "PPI.png",width =8,height =6,dpi=300)
cairo_pdf("PPI.pdf",height=8,width=10,family="Times")
print(plotout)
dev.off()#记得关闭画布
cairo主要用于SVG、PDF 和 PostScript 格式图形文件的存储
使用方法:
svg(filename = if(onefile) "Rplots.svg" else "Rplot%03d.svg",
    width = 7, height = 7, pointsize = 12,
    onefile = FALSE, family = "sans", bg = "white",
    antialias = c("default", "none", "gray", "subpixel"),
    symbolfamily)

cairo_pdf(filename = if(onefile) "Rplots.pdf" else "Rplot%03d.pdf",
          width = 7, height = 7, pointsize = 12,
          onefile = FALSE, family = "sans", bg = "white",#支持字体自定义
          antialias = c("default", "none", "gray", "subpixel"),
          fallback_resolution = 300, symbolfamily)

cairo_ps(filename = if(onefile) "Rplots.ps" else "Rplot%03d.ps",
         width = 7, height = 7, pointsize = 12,
         onefile = FALSE, family = "sans", bg = "white",
         antialias = c("default", "none", "gray", "subpixel"),
         fallback_resolution = 300, symbolfamily)
成功导出:
- 发表于 2024-01-11 14:14
- 阅读 ( 2780 )
- 分类:R
