make Cladogram with microbiomemarker
给大家介绍一个R包用于绘制Cladogram,直接附上代码:
if (!requireNamespace("BiocManager", quietly = TRUE)) { install.packages("BiocManager")}BiocManager::install("microbiomeMark...
给大家介绍一个R包用于绘制Cladogram,直接附上代码:
if (!requireNamespace("BiocManager", quietly = TRUE)) {
install.packages("BiocManager")
}
BiocManager::install("microbiomeMarker")
library(microbiomeMarker)
library(ggplot2)
#方便起见,直接使用该包自带的数据,构建一个phyloseq格式的数据
data(kostic_crc)
#标准化数据并通过内置的差异分析方法计算
kostic_crc_small <- phyloseq::subset_taxa(
kostic_crc,
Phylum %in% c("Firmicutes")
)
mm_lefse <- run_lefse(
kostic_crc_small,
wilcoxon_cutoff = 0.05,
group = "DIAGNOSIS",
kw_cutoff = 0.05,
multigrp_strat = TRUE,
lda_cutoff = 3
)
# 然后绘图,这里可以用一些ggplot的命令
plot_cladogram(mm_lefse, only_marker = TRUE, color =c("darkgreen", "red")) +
theme(
legend.position = "bottom",
legend.text = element_text(size = 6),
legend.key.size = unit(0.3, 'cm'),
legend.spacing.x = unit(0.2, '
cm
'),
legend.spacing.y = unit(0.2, 'cm'
),
legend.margin = margin(t = 5, b = 5, l = 5, r = 5),
plot.title = element_text(hjust = 0.5, face = "bold"),
axis.text = element_text(size = 8)
)
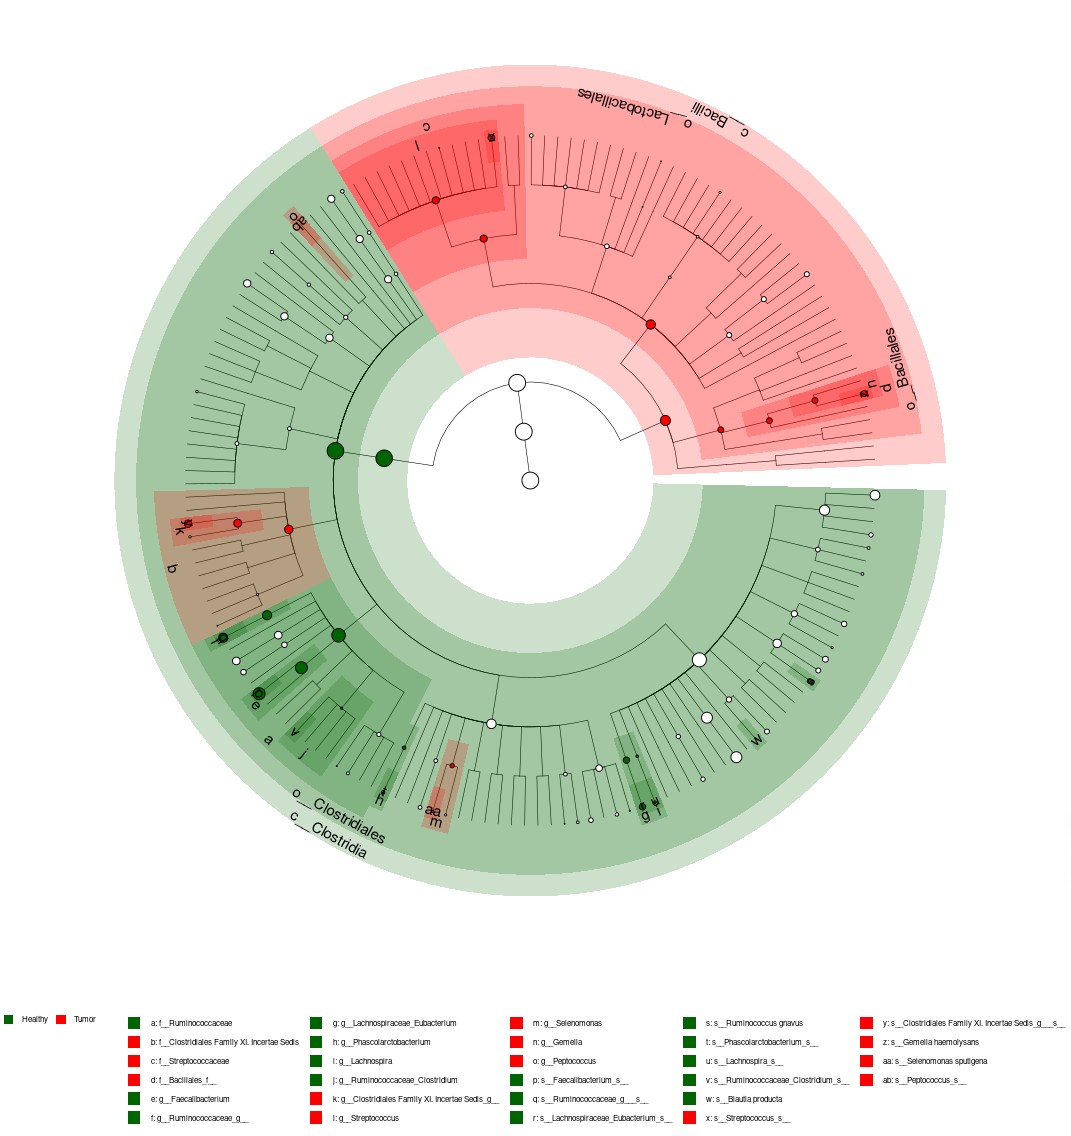
非常简单就能画出一个图,绘图需要的数据格式是,可以自己构建也可以借助这个包的import函数,支持非常多的数据格式,比如常见的dada2,qiime2,biom都可以直接读取然后绘图
github地址是 https://github.com/yiluheihei/microbiomeMarker
参考资料
yang. (2020). yiluheihei/microbiomeMarker: microbiomeMarker 0.0.1 (v0.0.1). Zenodo. https://doi.org/10.5281/zenodo.37494
- 发表于 2023-12-28 11:11
- 阅读 ( 2222 )
- 分类:R
