R包 CandiHap 进行单倍型分析
CandiHap是一款应用于全基因组关联分析(GWAS)后,快速分析基因单倍型来鉴定候选基因的一款友好软件。研究者可通过该软件对单个基因,或者对GWAS显著关联位点LD范围内所有基因进行单倍型分析,发现与性状显著关联的单倍型和候选基因。
CandiHap是一款应用于全基因组关联分析(GWAS)后,快速分析基因单倍型来鉴定候选基因的一款友好软件。研究者可通过该软件对单个基因,或者对GWAS显著关联位点LD范围内所有基因进行单倍型分析,发现与性状显著关联的单倍型和候选基因。
需要准备4个文件,分别为群体变异vcf文件、ANNOVAR软件注释后的txt文件、物种基因组GFF注释文件、群体表型性状文件。其中vcf文件和表型性状文件为我们测序和测定结果,GFF基因结构注释文件可从基因组数据库下载。注释后的txt文件需使用ANNOVAR软件对vcf文件中SNP和INDEL进行注释得到。
R流程如下:
perl  vcf2hmp.pl  test.vcf  test.si_multianno.txt  0.1

library(CandiHap)
if (! require("eoffice")) install.packages("eoffice")
gff <- importGFF("test.gff",format="gff3")
gr<-preGranges(gff,gene="Si9g49990",cds = T)
#hmp <- read_vcf('test.vcf')           # or if you use vcf file
hmp <- read_hmp("haplotypes.hmp")
ovl <- findover(gr,hmp)
pheno <- read_pheno("Phenotype.txt",sep="\t")
hap <- snp2hap(pheno,ovl, hapname="Hap")
## want to extract results
Hap_results <- results(hap, gene="Si9g49990")
write.table(Hap_results, file = "Hap_results.txt", sep = "\t", quote = FALSE, col.names = T, row.names = F)
## Plot Gene LDheatmap
if (! require("LDheatmap")) install.packages("LDheatmap")
if (! require("genetics")) install.packages("genetics")
LDsnp <- Hap_results[, !names(Hap_results) %in% c("sample","Info")]
LDsnp = LDsnp[,-ncol(LDsnp)]
NAs <- LDsnp == "N/N"
is.na(LDsnp)[NAs] <- TRUE
LDsnp[NAs] <- NA
LDsnp = LDsnp[-1,]
Dist = as.numeric(LDsnp[1,])
LDsnp = LDsnp[-c(1:6),]
num<-ncol(LDsnp)
for(i in 1:num){
    LDsnp[,i]<-as.genotype(LDsnp[,i])
}
rgb.palette <- colorRampPalette(rev(c("#1F77B4", "#AEC7E8", "#FF7F0E")), space = "rgb")
LDheatmap(LDsnp, genetic.distances = Dist, flip = TRUE, color=rgb.palette(40))
topptx(filename ="LDheatmap.pptx")
# gene figures
snplot(hap,gene="Si9g49990",side=F)
snplot(hap,gene="Si9g49990",side=F,random = F)
topptx(filename ="gene_figure.pptx")
snplot(hap,gene="Si9g49990",side=T,random = F,hapname="Hap3")
snplot(hap,gene="Si9g49990",side=F,random = F,hapname="Hap15",mutateOnly=TRUE)
## boxplot
snboxplot(hap,gene="Si9g49990",feature = "Height")
topptx(filename ="snboxplot.pptx")
hapnet(hap,gene="Si9g49990",feature = "Height")
topptx(filename ="hapnet.pptx")
# plot gene track with snp
library(CandiHap)
dat <- read_data("track-Phenotype.gwas.txt",sep="\t")
# notice that the dat should have the chromosome name in the first column, position in the second column and the values in the following columns
snptrack(gff,dat=dat,id="Parent",color='r2', point.size = 0.2, high = "#DC0000B2",low ="blue", chr = 9,  region = c(54450000, 54700000))
topptx(filename ="snptrack1.pptx")
## id is the gene name you want to display, in gff3 file should be 'Parent'
#show snp locate in gene only
snptrack(gff,dat=dat,id="Parent",geneOnly=F, color='r2', low='green',high='red', point.size = 0.5, chr = 9,  region = c(54520000, 54620000))
topptx(filename ="snptrack.pptx")
## show some genes
snptrack(gff,dat=dat,id="Parent",gene='Si9g49990',color='r2',upstream=2000)
topptx(filename ="gene_snptrack.pptx")
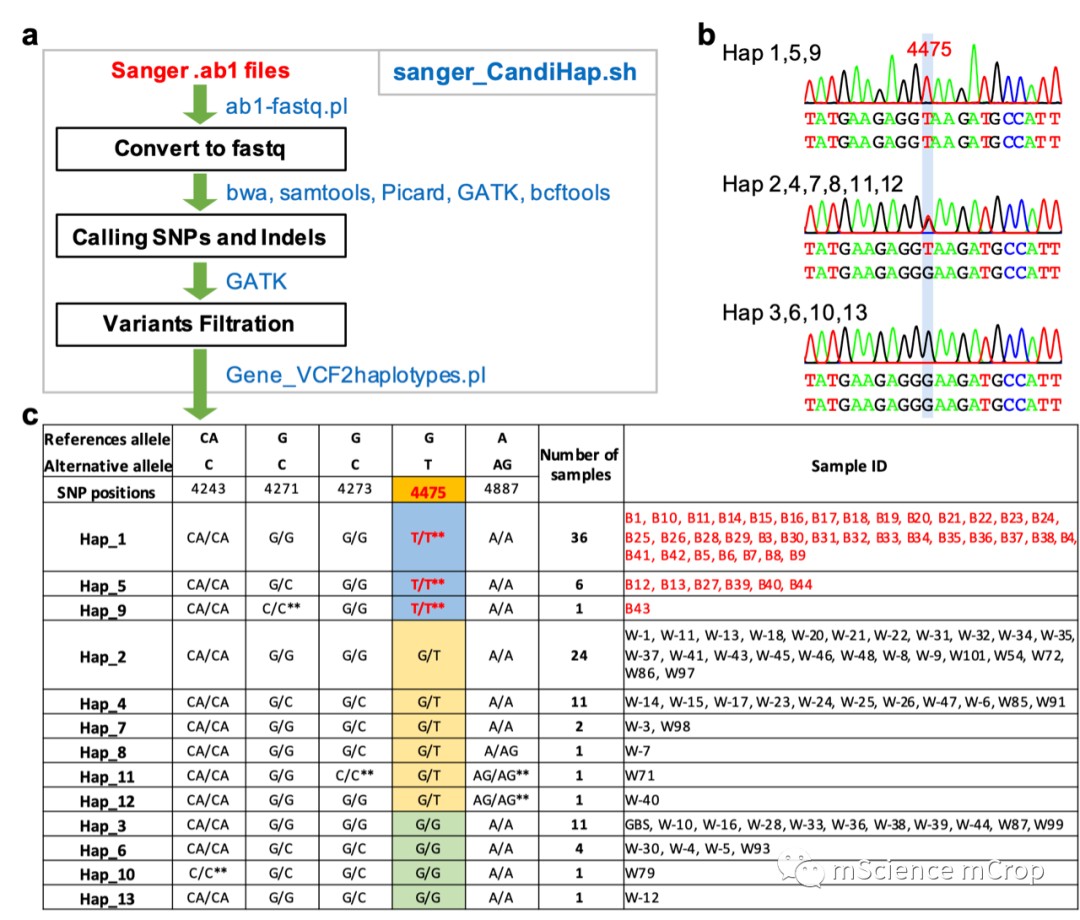
也可以根据vcf文件直接生成单倍型分类文件,但是这个功能只有linux可以实现,主要借助脚本Gene_VCF2haplotypes.pl,流程和结果如下:
参考资料:
CandiHap 群体数据进行单倍型分析软件介绍 (qq.com)
R包 CandiHap 使用视频教程,画图一步到位! (qq.com)
Li, X., Shi, Z., Gao, J. et al. CandiHap: a haplotype analysis toolkit for natural variation study. Mol Breeding 43, 21 (2023). https://doi.org/10.1007/s11032-023-01366-4
- 发表于 2023-10-16 15:30
- 阅读 ( 6646 )
- 分类:软件工具
