绘制类似于箱线图的散点图
使用R语言绘制类似于箱线图的散点图
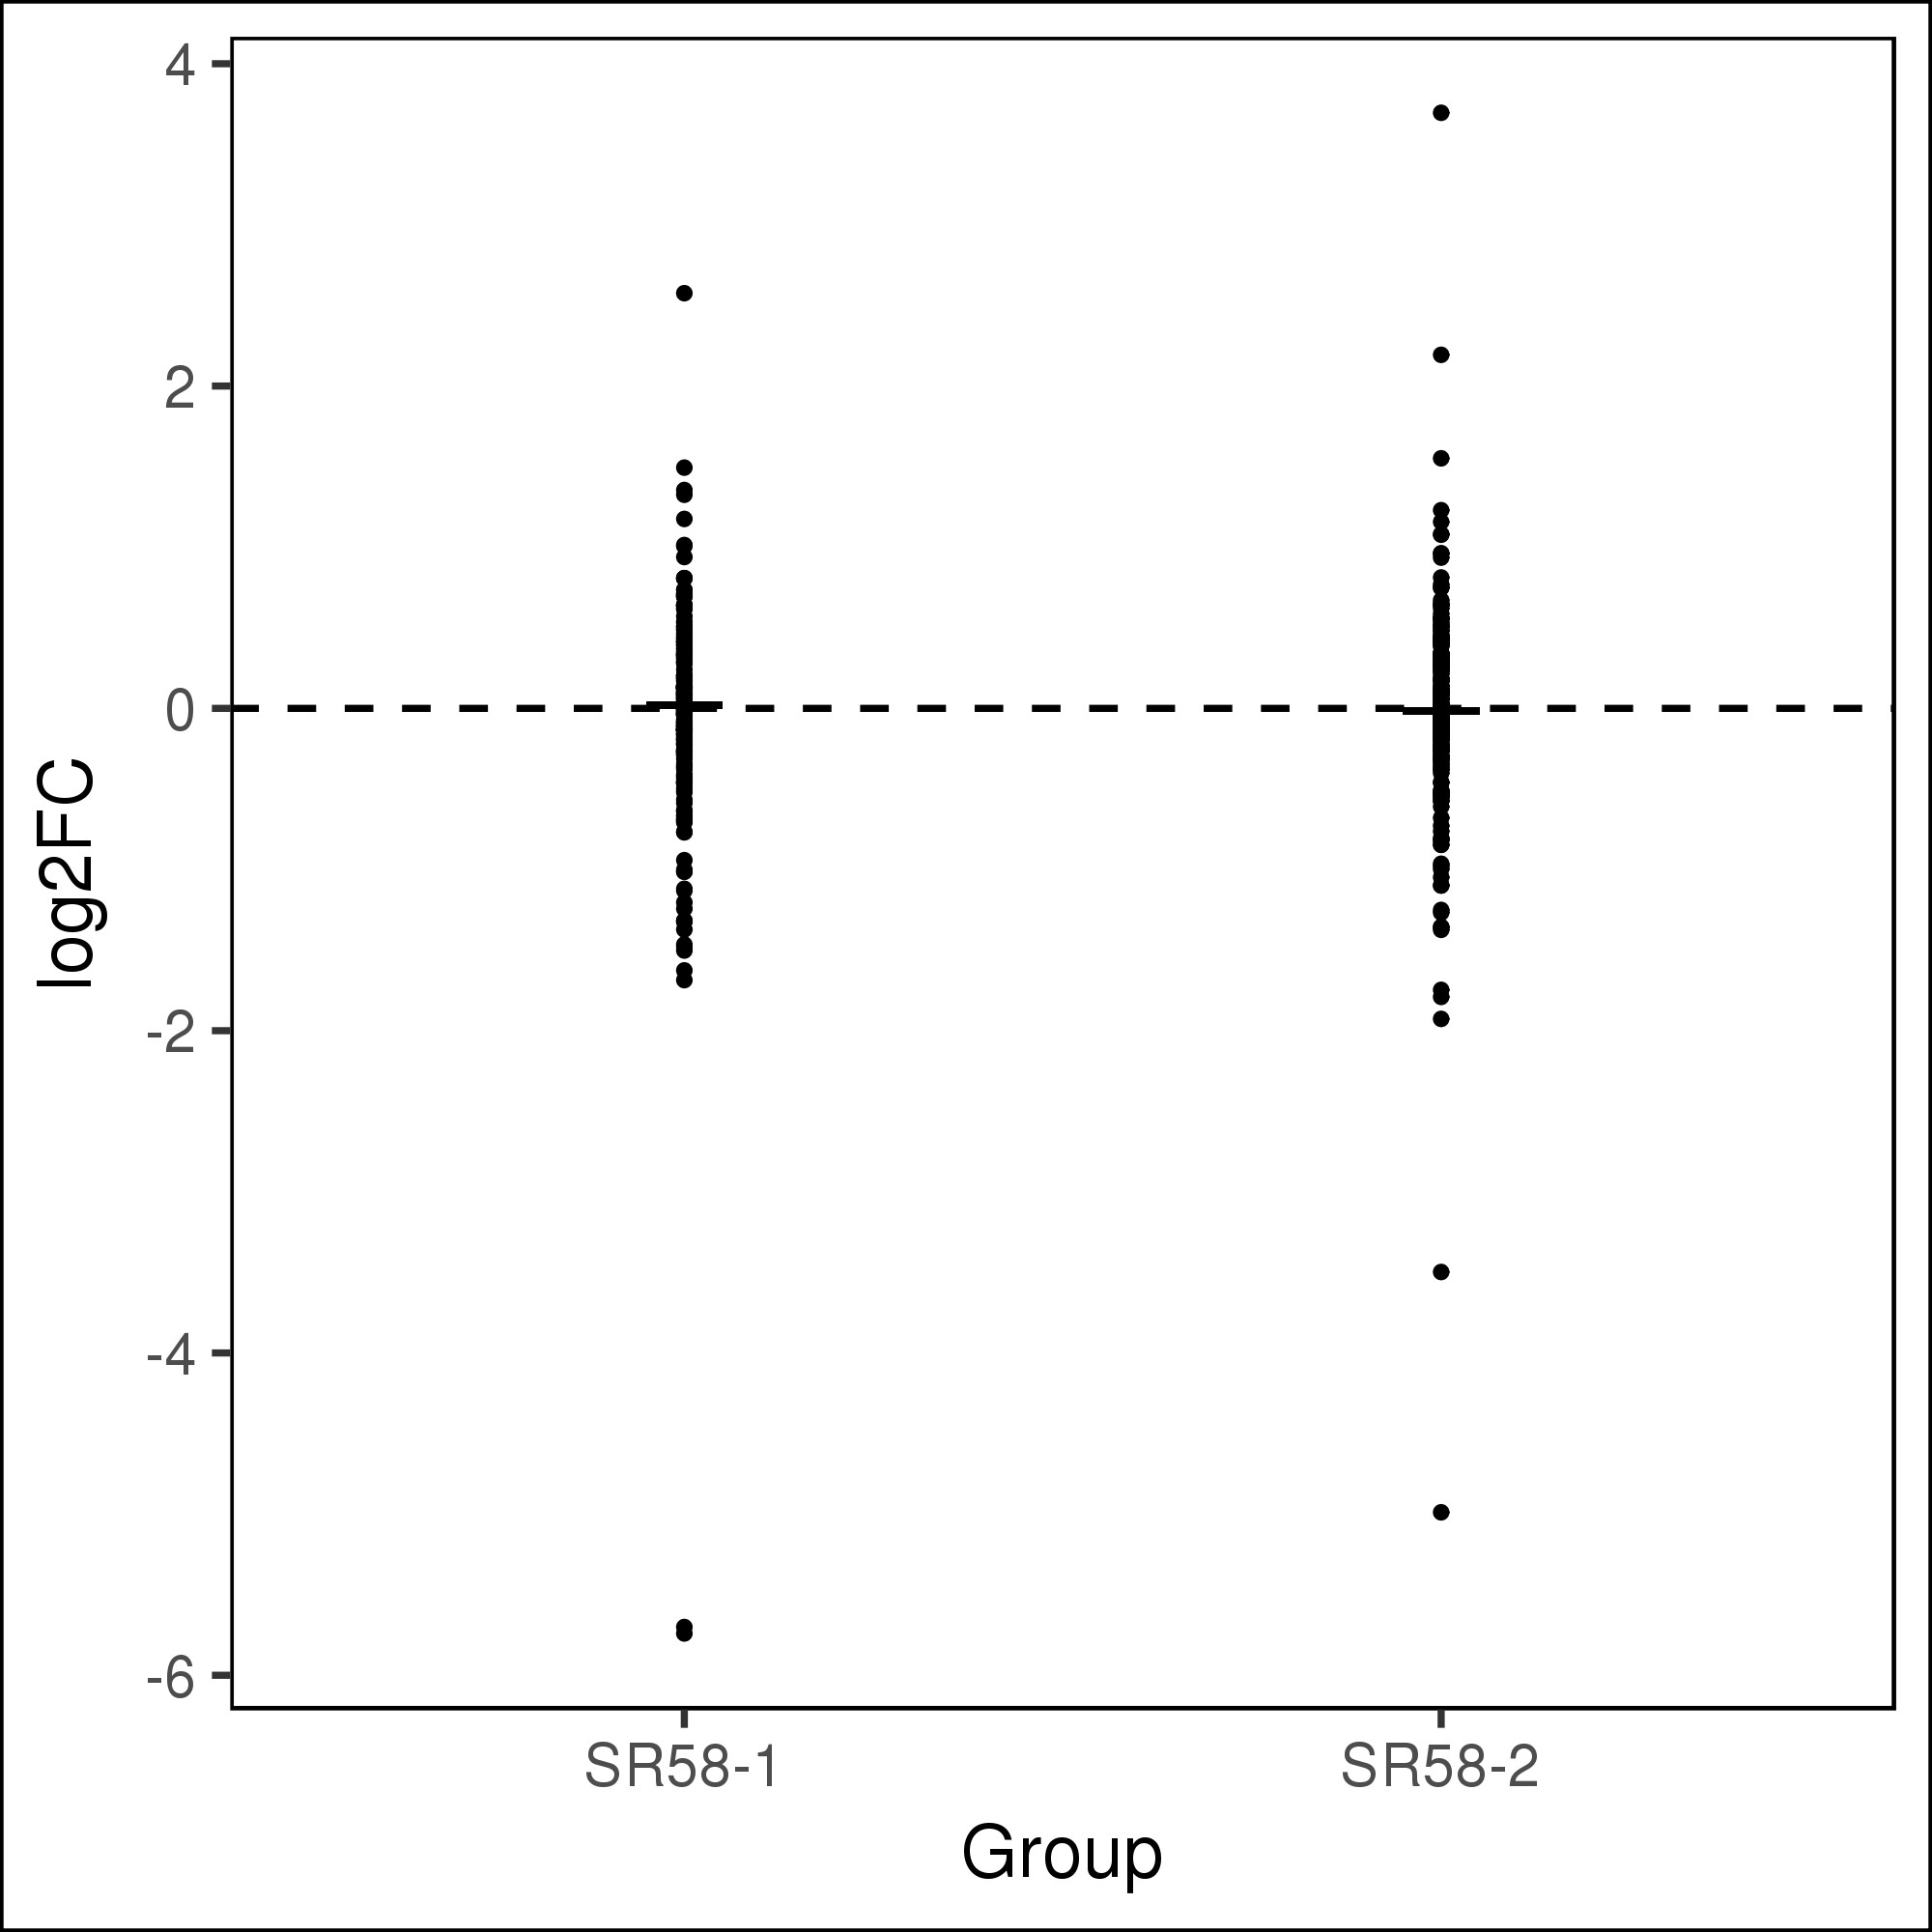
下图是一类似箱线图的点图,其中横坐标是两个差异组合,纵坐标为差异倍数。
作图需要整备两个文件,即各差异组合差异基因的差异倍数,如下所示:
log2FC          Group
-0.003569046    SR58-1
-0.033401692    SR58-1
-0.00595792     SR58-1
-0.126160677    SR58-1
-0.003569046    SR58-1
0.062951504     SR58-1
-0.085369416    SR58-1
0.061838866     SR58-1
-0.006699121    SR58-1
-0.006699121    SR58-1
0.565357698     SR58-1
-1.478225114    SR58-1
-0.081035817    SR58-1
-0.103533775    SR58-1
-0.143437623    SR58-1
-0.103533775    SR58-1
-0.143437623    SR58-1
-0.095751056    SR58-1
0.358148301     SR58-1
-0.187767352    SR58-1
0.389438905     SR58-1
绘图用的是R脚本,代码为:
library(ggplot2)
library('getopt');
spec = matrix(c(
'help' , 'h', 0, "logical","for help",
'input1' , 'i', 1, "character","input the abuance of tax in each sample ,required",
'input2' , 's', 1, "character","input the abuance of tax in each sample ,required",
#'row' , 'r' , 1 , "character","row name,required",
'name' , 'n', 1, "character","photo name"
), byrow=TRUE, ncol=5);
opt = getopt(spec);
print_usage <- function(spec=NULL){
cat(getopt(spec, usage=TRUE));
q(status=1);
}
if ( !is.null(opt$help) ) { print_usage(spec) }
if ( is.null(opt$input1) ){ print_usage(spec) }
if ( is.null(opt$input2) ){ print_usage(spec) }
if ( is.null(opt$name) ){ opt$name = "Co-occurrence_network" }
#读入数据
point1 <- read.table(opt$input1,sep="\t",header = TRUE,comment.char = "")
point2 <- read.table(opt$input2,sep="\t",header = TRUE,comment.char = "")
#分别取中位数
median1 = median(point1$log2FC, na.rm = FALSE)
median2 = median(point2$log2FC, na.rm = FALSE)
print(median1)
print(median2)
#行合并
point = rbind(point1,point2)
p <- ggplot(point, aes(x=Group, y=log2FC)) + geom_point(size=0.5)+
geom_segment(aes(x=0.95,y=median1,xend=1.05,yend=median1))+
geom_segment(aes(x=1.95,y=median2,xend=2.05,yend=median2))+
geom_hline(aes(yintercept=0), colour="#000000", linetype="dashed")+
theme(
######取消默认的背景颜色方框等
panel.background = element_rect(fill = "transparent",colour = "black"),
panel.grid.minor = element_blank(),
panel.grid.major = element_blank(),
plot.background = element_rect(fill = "transparent",colour = "black"))
#输出文件名称
png_name=paste(opt$name, ".png", sep="")
pdf_name=paste(opt$name, ".pdf", sep="")
#输出pdf格式图片
pdf(pdf_name,width =3,height = 3)
print(p)
dev.off()
#输出png格式图片
png(png_name,width =2000,height =2000,res = 500,units = "px")
print(p)
dev.off()
- 发表于 2018-06-08 12:06
- 阅读 ( 6559 )
- 分类:R
