亚型划分比较波浪图(桑基图)绘制
亚型划分比较波浪图(桑基图)绘制
桑基图,也叫桑基能量分流图或者桑基能量平衡图。它是一种特定类型的流程图,图中延伸的分支的宽度对应数据流量的大小,所有主支宽度的总和应与所有分出去的分支宽度的总和相等,保持能量的平衡,非常适用于用户流量等数据的可视化分析。在一些高分文章中我们有时会看到她的身影。
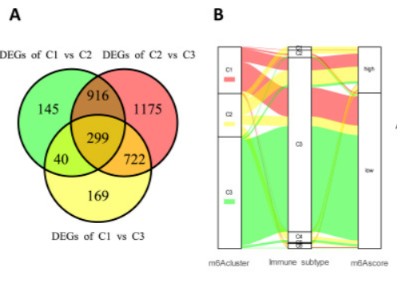
比如在一篇2021年发表于The Journal for ImmunoTherapy of Cancer上的影响因子为13.75的文献《m6A modification patterns and tumor immune landscape in clear cell renal carcinoma》中,作者利用桑基图来描绘m6A簇、免疫亚型和m6A score的变化(B图)。
桑基图的绘制
为了使大家能更简便快捷地绘制出精美的桑基图,这里我们给大家提供一个绘制桑基图的R脚本,这个脚本只需要准备好相应的输入文件,再进行简单的命令行操作即可绘制可直接用于文章发表的桑基图。
使用命令:
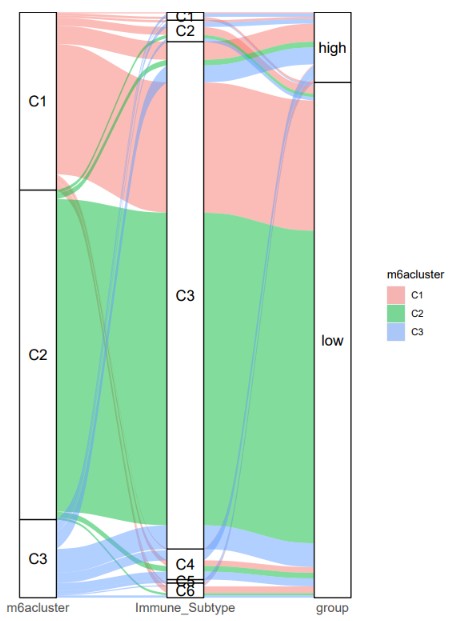
Rscript sankey_plot.r -i metadata_group.tsv -g m6acluster Immune_Subtype group -c m6acluster -p demo
结果展示:
输入文件准备
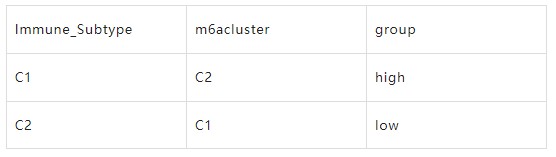
这个脚本需要一个输入文件即可,由-i参数指定,格式如下
更多脚本参数设置及说明
通过-h参数获得以下帮助信息。
usage: sankey_plot.r [-h] -i input -g group [group ...] -c color [-o outdir]
[-p prefix] [-H height] [-W width]

Sankey plot drawing

optional arguments:
  -h, --help                               show this help message and exit

  -i input, --input input
                        input the matrix [required]
  -g group, --group group
                        input column names of three groups [required]
  -c color, --color color
                        column to fill color [required]
  -o outdir, --outdir outdir
                        output file directory [default cwd]
  -p prefix, --prefix prefix
                        out file name prefix [default result]
  -H height, --height height
                        the height of pic inches [default 5]
  -W width, --width width
                        the width of pic inches [default 5]
必需参数
-i 包含具有对应关系的数据
-g 输入所要绘制桑基图的三列数据的列名
-c 决定分流所填充颜色的列名
其他参数
-o 输出文件存放路径,默认为当前路径
-p 文件名,默认result
-H、-W 输出图片长宽,单位inch,默认均为5
脚本获取方法
在公众号回复sankey_plot即可获得网络图绘制脚本的网盘链接以及提取码。
如何使用命令行的方法分析数据
可能有的人没有用过命令的形式分析数据, 可以学习下面的课程入门一下:

延伸阅读

- 发表于 2022-06-15 13:15
- 阅读 ( 2768 )
- 分类:R
