sankey_plot.r绘制桑基图
绘制桑基图(冲击图)
使用方法:
usage: script/sankey_plot.r [-h] -i input -g group [group ...] -c color
                            [-o outdir] [-p prefix] [-H height] [-W width]

Sankey plot drawing

optional arguments:
  -h, --help            show this help message and exit
  -i input, --input input
                        input the matrix [required]
  -g group [group ...], --group group [group ...]
                        input column names of three groups [required]
  -c color, --color color
                        column to fill color [required]
  -o outdir, --outdir outdir
                        output file directory [default cwd]
  -p prefix, --prefix prefix
                        out file name prefix [default result]
  -H height, --height height
                        the height of pic inches [default 5]
  -W width, --width width
                        the width of pic inches [default 5]
参数说明:
-i 包含具有对应关系的数据
| Immune_Subtype | m6acluster | group |
| C1 | C2 | high |
| C2 | C1 | low |
-g 输入所要绘制桑基图的三列数据的列名
-c 决定分流所填充颜色的列名
使用举例:
Rscript script/sankey_plot.r -i /share/nas1/fangs/test/m6A/TCGA-KIRC/06.m6a_score/metadata_group.tsv -g m6acluster Immune_Subtype group -c m6acluster -p demo
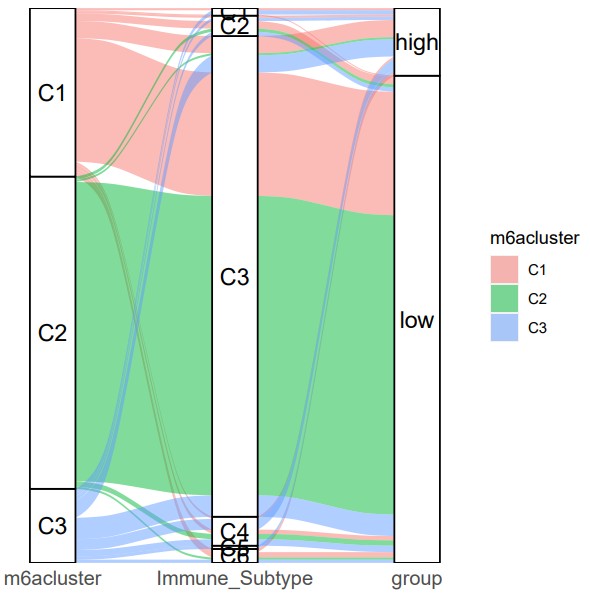
结果展示:
- 发表于 2021-10-29 15:54
- 阅读 ( 2873 )
- 分类:R
