GOChord_plot.r GOplot包绘制GO弦图
R包GOplot将GO富集分析结果可视化,绘制弦图
使用方法:
$Rscript $scriptdir/GOChord_plot.r -h
usage: /share/nas1/fangs/test/Ferroptosis-Related/TCGA-ESCC/scripts/GOChord_plot.r
       [-h] -g GO_DATA -d DEG_DATA [--no_logFC] [--gene GENE] [--GO GO]
       [-z GENE_SIZE] [-S GENE_SPACE] [-s GO_SPACE] [-t TITLE] [-o OUTDIR]
       [-p PREFIX] [-H HEIGHT] [-W WIDTH]

GOChord plot:https://www.omicsclass.com/article/1532

optional arguments:
  -h, --help            show this help message and exit
  -g GO_DATA, --GO_data GO_DATA
                        input a GO enrichment analysis data,the data with
                        columns for 'category','ID','term',adjusted
                        p-value('adj_pval') and 'genes'[required]
  -d DEG_DATA, --deg_data DEG_DATA
                        input the result of differential expression analysis
                        corresponding to GO enrichment analysis,the data with
                        columns for 'ID', 'logFC'[required]
  --no_logFC            There is no logFC value[optional,default False]
  --gene GENE           The number of GOterms associated with a
                        gene[optional,default 3]
  --GO GO               The number of genes associated with a
                        GOterms[optional,default 5]
  -z GENE_SIZE, --gene_size GENE_SIZE
                        The size of the gene name[optional,default 5]
  -S GENE_SPACE, --gene_space GENE_SPACE
                        The spacing between genes[optional,default 0.25]
  -s GO_SPACE, --GO_space GO_SPACE
                        The spacing between GOterms[optional,default 0.02]
  -t TITLE, --title TITLE
                        the title of the String figure[optional,default
                        GOChord_plot]
  -o OUTDIR, --outdir OUTDIR
                        output file directory[optional,default cwd]
  -p PREFIX, --prefix PREFIX
                        out file name prefix[optional,default GOChord_plot]
  -H HEIGHT, --height HEIGHT
                        the height of the String figure[optional,default 18]
  -W WIDTH, --width WIDTH
                        the width of the String figure[optional,default 20]
参数说明:
-g 输入GO富集分析结果文件,文件的列中必须含有"category"(BP/CC/MF)、''ID"(GO ID)、"term"(功能描述)、"adj_pval"(校正后的p值)和"genes"(每个GO term中含有的gene ID):
| category | ID | term | GeneRatio | BgRatio | pvalue | adj_pval | qvalue | genes | Count |
| BP | GO:0006979 | response to oxidative stress | 10/37 | 458/18866 | 1.25E-08 | 1.79E-05 | 1.27E-05 | TXNIP/FANCD2/ANGPTL7/NOX4/NCF2/HSPB1/PRKAA2/G6PD/TNFAIP3/HBA1 | 10 |
| BP | GO:0062197 | cellular response to chemical stress | 8/37 | 360/18866 | 3.87E-07 | 0.000277 | 0.000198 | FANCD2/SLC2A1/NOX4/NCF2/HSPB1/PRKAA2/G6PD/TNFAIP3 | 8 |
| BP | GO:0001894 | tissue homeostasis | 7/37 | 261/18866 | 6.46E-07 | 0.000308 | 0.000220 | TFRC/ALB/SLC2A1/NOX4/HSPB1/TF/TNFAIP3 | 7 |
-d 输入用于GO富集分析的基因文件,文件列中必须含有""ID"(gene ID)和"logFC"(差异倍数),若没有差异倍数,会添加"logFC"列并将差异倍数设置为0:
| ID | FDR | PValue | logFC | Regulate |
| MT1G | 2.24E-12 | 8.09E-15 | -4.156082 | Down |
| PLIN4 | 6.05E-12 | 2.55E-14 | -3.419216 | Down |
| RRM2 | 6.55E-09 | 6.50E-11 | 2.694453 | Up |
--no_logFC
输入文件是否有差异倍数,有则无需设置,没有则需要设置该参数
--gene 5 --GO 4
--gene是设置每个gene至少对应的GO term数,如基因对应的GO term数没有达到设置的值,那么该gene将不会在图中显示
--GO是设置每个GO term至少含有的gene数,如GO term含有的gene数没有达到设置的值,那么该GO term也将不会在图中显示
-z 5 -S 0.25 -s 0.02
-z是设置图中gene ID的字体大小,-S是设置图中gene间的间隔大小,-s是设置图中GO term间的间隔大小
使用举例:
$Rscript $scriptdir/GOChord_plot.r -g GO/TP_vs_NT_GO_enrichment_stat.tsv \
    -d ../03.deg/fer_deg_gene.tsv --gene 5 --GO 4
结果展示: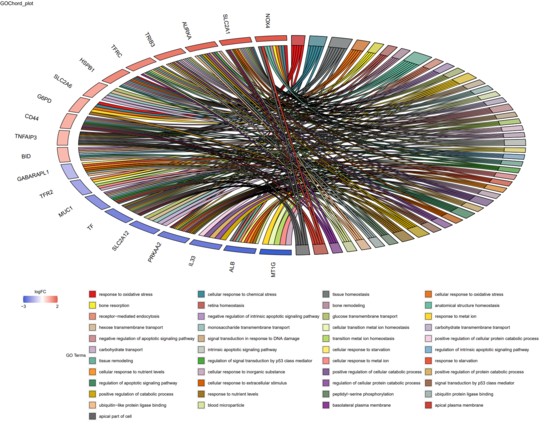
- 发表于 2021-08-25 15:30
- 阅读 ( 4867 )
- 分类:R
