lasso_cox.r lasso_cox 模型优化分析
使用说明:
Rscript $scriptdir/lasso_cox.r -h
usage: /work/my_stad_immu/scripts/lasso_cox.r [-h] -i data -t time -e event -v
                                              variate [variate ...] [-s seed]
                                              [-l lambda] [-P predict.time]
                                              [-o outdir] [-p prefix]

lasso cox regression analysis

optional arguments:
  -h, --help            show this help message and exit
  -i data, --data data  input data file path[required]
  -t time, --time time  set suvival time column name [required]
  -e event, --event event
                        set event column name [required]
  -v variate [variate ...], --variate variate [variate ...]
                        variate for cox analysis [required]
  -s seed, --seed seed  set random seed [default 2021]
  -l lambda, --lambda lambda
                        set lambda cut off [default NULL]
  -P predict.time, --predict.time predict.time
                        Time point of the ROC curve to select cutoff [default
                        365 1095 1825]
  -o outdir, --outdir outdir
                        output file directory [default cwd]
  -p prefix, --prefix prefix
                        out file name prefix [default lasso_cox]
使用举例:
Rscript $scriptdir/lasso_cox.r -i imm.unicox.metadata-exp.tsv -e EVENT -t TIME \
  -v SYT12 CDH2 GPNMB TMIGD3 LINC01094 SLC22A20P IGHV4-61 IGHV2-5 SERPINA5 MS4A4A FAM83A IGLV3-9 STARD3    -o lasso
参数说明:
-i 输入生存数据与基因表达文件
| barcode | TIME | EVENT | FGR | CD38 | ITGAL | CX3CL1 | CEACAM21 | MATK | CD79B | MMP25 |
| TCGA-B7-A5TK-01A-12R-A36D-31 | 288 | 0 | 16.34408 | 86.86772 | 40.26903 | 603.0132 | 1.868536 | 2.28342 | 3.453198 | 13.72829 |
| TCGA-BR-7959-01A-11R-2343-13 | 1010 | 0 | 11.96739 | 15.79451 | 7.358566 | 26.91353 | 2.571917 | 0.864116 | 1.879957 | 3.451148 |
| TCGA-IN-8462-01A-11R-2343-13 | 572 | 0 | 5.350846 | 3.111342 | 3.769125 | 20.22238 | 0.610839 | 0.519776 | 2.822192 | 1.106563 |
| TCGA-CG-4443-01A-01R-1157-13 | 912 | 0 | 1.53802 | 0.862955 | 2.37351 | 19.04097 | 1.092127 | 0.760348 | 1.926592 | 0.878735 |
| TCGA-KB-A93J-01A-11R-A39E-31 | 1124 | 0 | 15.24016 | 13.3047 | 38.08591 | 14.15295 | 3.483559 | 3.192951 | 3.651742 | 10.43186 |
| TCGA-HU-A4H3-01A-21R-A251-31 | 882 | 0 | 6.261761 | 2.675173 | 7.025886 | 4.050271 | 0.584159 | 1.039336 | 1.979214 | 2.312993 |
| TCGA-RD-A8MV-01A-11R-A36D-31 | 3720 | 0 | 27.07415 | 20.15885 | 34.91309 | 34.71821 | 4.113112 | 2.615557 | 16.51946 | 17.72674 |
结果展示:
lasso变量筛选与模型构建:
Lasso(Least
absolute shrinkage and selection operator)方法进一步筛选变量优化模型。 Lasso主要用来进行变量筛选,特别是当自变量之间有共线性时很有用, 我们用10fold 交叉验证的方法排除共线性严重的基因优化和简化模型。该分析可以使用R包glmnet(Friedman et al. 2010)完成。
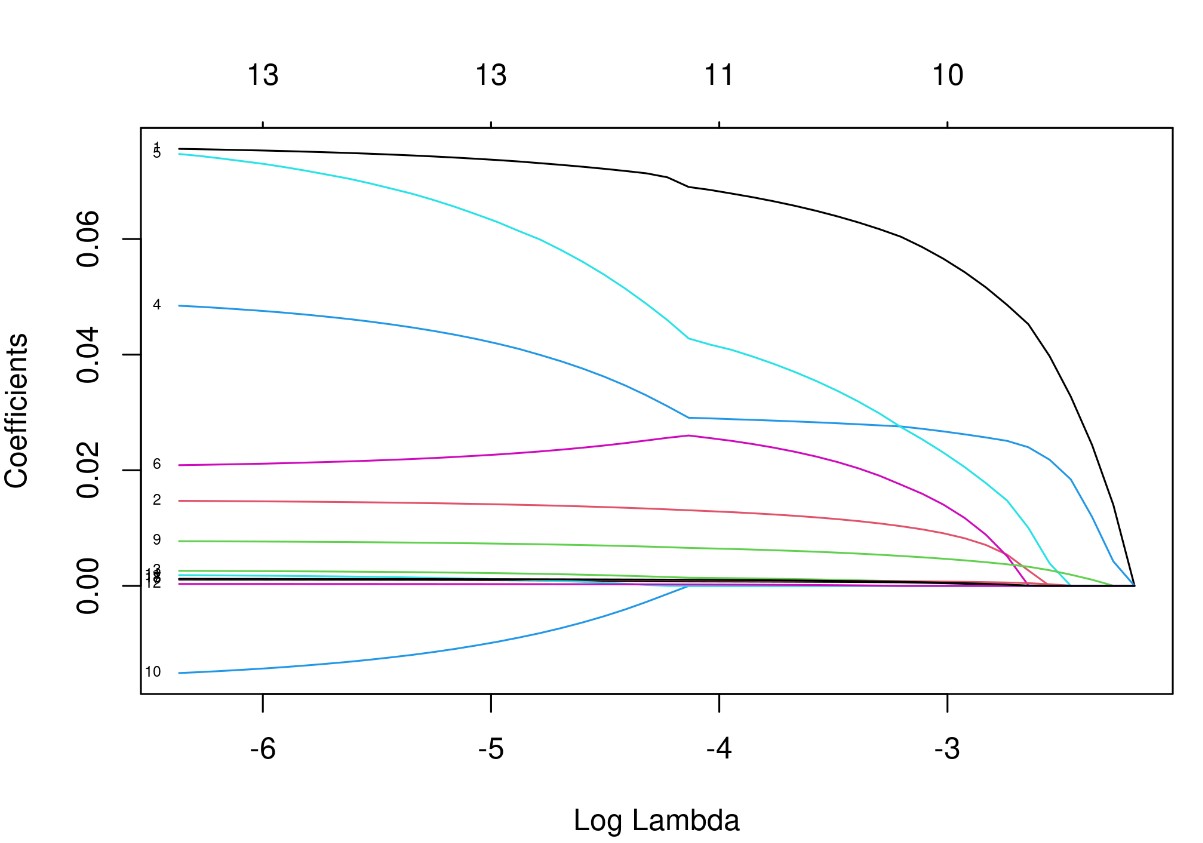 注:LASSO为寻找最佳的模型,引入变量λ (lambda 又叫收缩算子、模型系数比、调优系数或惩罚值) 随着λ增加,各变量的回归系数β在减小,有些会变为0,说明该变量在此时对模型贡献微乎其微,可以剔除。图中,一条彩线代表一个变量的回归系数β值的变化,x轴下方的数字为惩罚值(调优系数),x轴上方为在该值下的剩余的变量个数。LASSO 回归就是通过生成一个惩罚函数对回归模型中的变量回归系数进行压缩,达到防止过度拟合,解决严重共线性的问题。
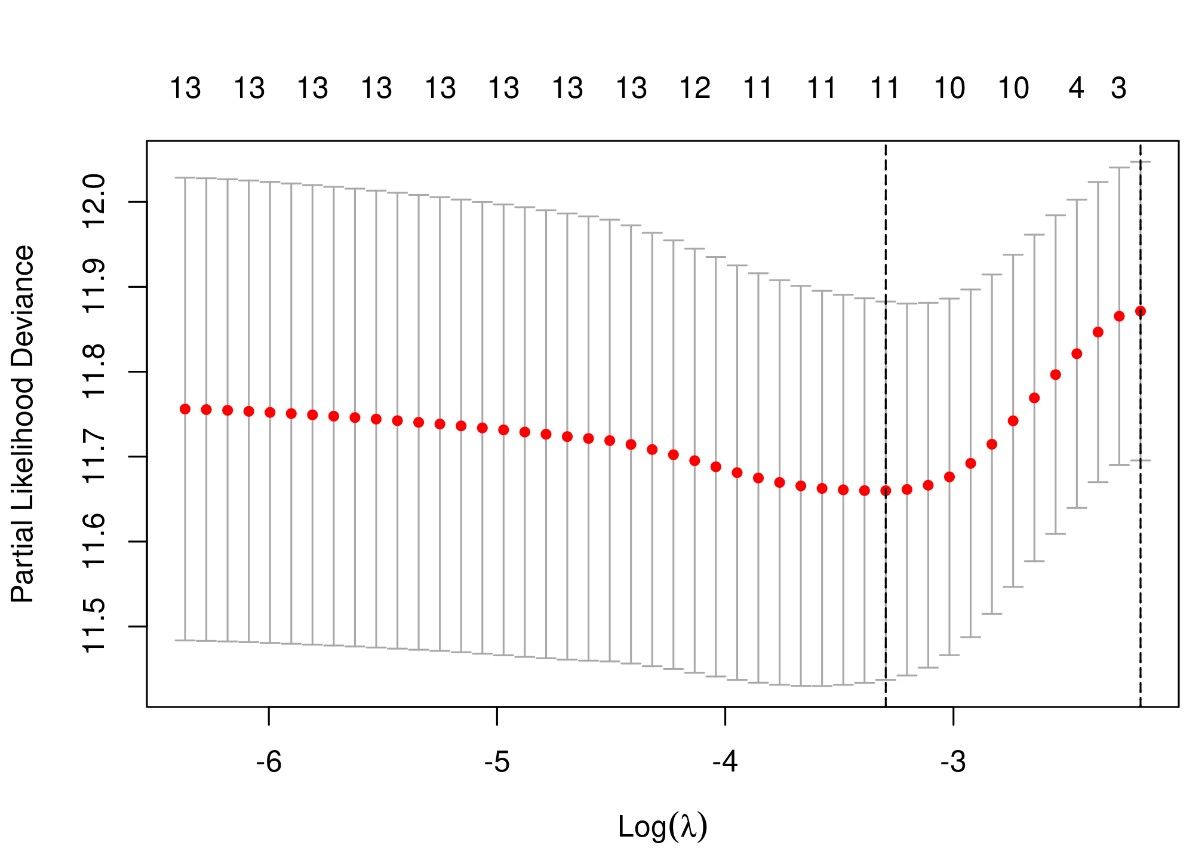
λ值决定了哪些变量可以使模型最优,使用交叉验证可寻找最佳λ值。Partial-likelihood deviance (偏似然偏差) 随Log(λ)变化曲线,此值越小说明模型拟合越好。图中给出了两个惩罚值(调优系数)λ: 一个是当偏似然偏差最小时的λ值,即lambda.min;
We applied the Cox regression model with LASSO based on the R package “glmnet” to construct an optimal gene‐associated prognostic model。
The Risk score was calculated with the following formula: The risk score=
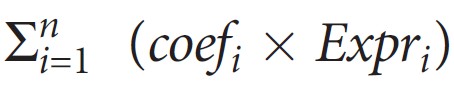
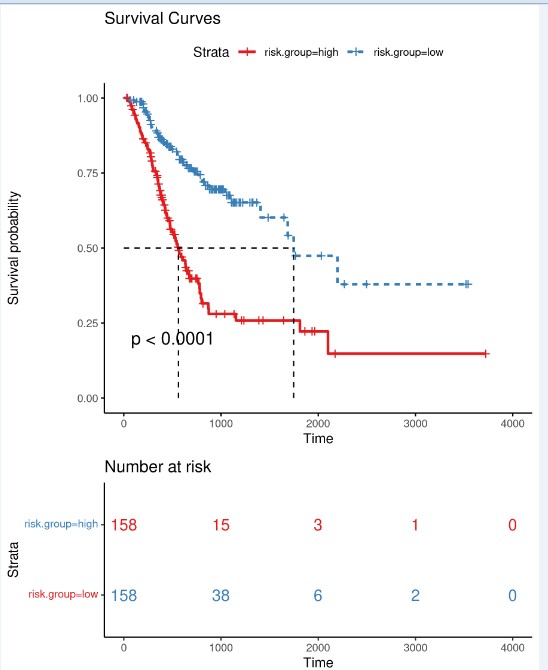
, where Expri represents the expression level of gene i and coefi represents the regression coefficient of gene i in the signature.We grouped all patients into low- or high-risk groups according to the median value of XXXX‐based risk signature and performed survival analysis with Kaplan-Meier method. The logrank test was used to compare the difference in the survival status between the high‐ and low‐risk groups.
风险评分
根据模型计算各样本分风险值,按照风险值的中位数将样本划分为高低风险组,分别绘制风险值分布散点图,生存时间散点图,signature基因表达热图。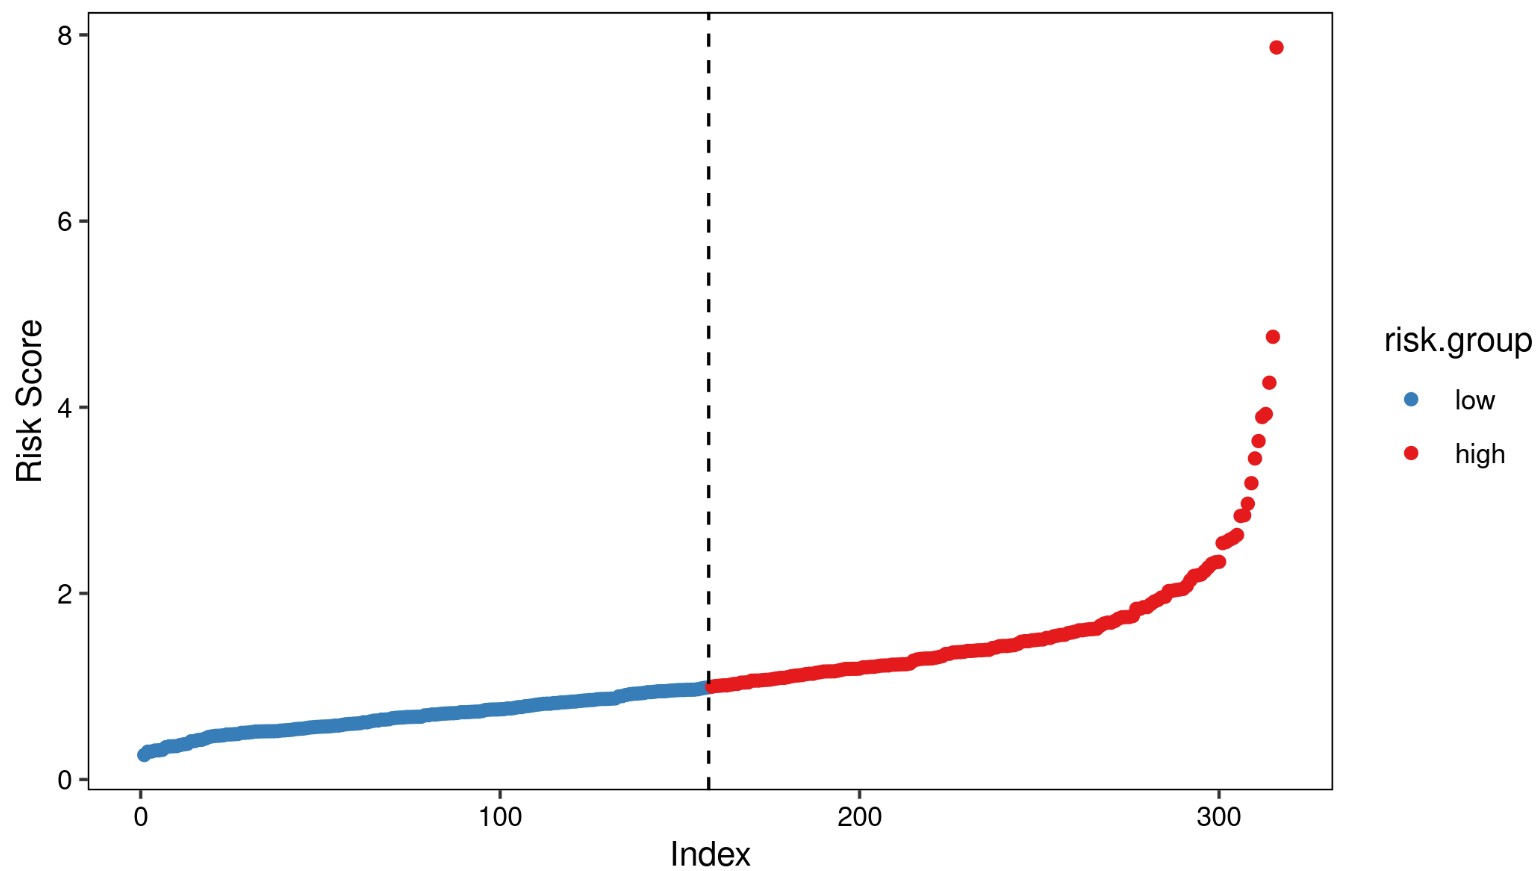
高低风险组预后差异分析:绘制Kaplan-Meier生存曲线,并用Log Rank法检验两组的生存率是否有差异。
模型预测性能评估
模型的好坏可以从区分度(Discrimination)和一致性(Calibration)两方面考虑。区分度主要用于反映预测模型的区分能力,是评估模型有多大把握确定它所预测的患者发生该事件的能力。一致性指结局实际发生的概率和预测的概率的一致性或者接近程度。前者可通过ROC曲线下面积(AUC)或C统计量来评价,后者可通过校准图来评价。以下为模型ROC曲线:
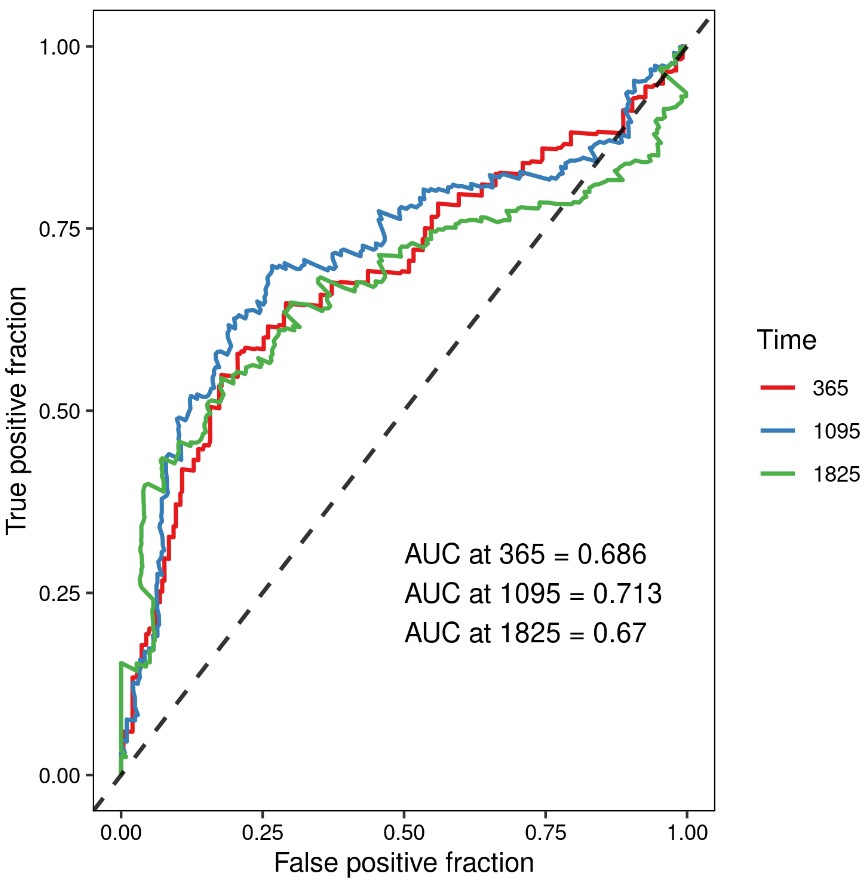
To reflect the prediction ability of the XXXX‐based risk signature, we generated the time-dependent receiver operating characteristic curve (ROC) and calculated the area under the curve (AUC) (R package “survivalROC” ) for 1-year, 3-year, and 5-year overall survival (OS). The Kaplan-Meier, log‐rank, ROC curve, and calibration analyses were all performed and visualized by the “survivalROC”, “rms”, “survival”, and “survminer” packages.
脚本获取与使用课程:https://study.163.com/course/introduction/1211864801.htm?share=1&shareId=1030291076
References
Simon, Noah, Jerome Friedman, Trevor Hastie, and Robert Tibshirani. 2011. “Regularization Paths for Cox’s Proportional Hazards Model via Coordinate Descent.” Journal of Statistical Software, Articles 39 (5): 1–13. https://doi.org/10.18637/jss.v039.i05.
Therneau, Terry M., and Patricia M. Grambsch. 2000. Modeling survival data: extending the Cox model. Springer.
Tibshirani R (1997) The lasso method for variable selection in the Cox model. Stat Med 16, 385–395.
lasso回归分析原理:https://www.omicsclass.com/article/1433
- 发表于 2021-06-25 17:00
- 阅读 ( 10441 )
- 分类:临床医学
