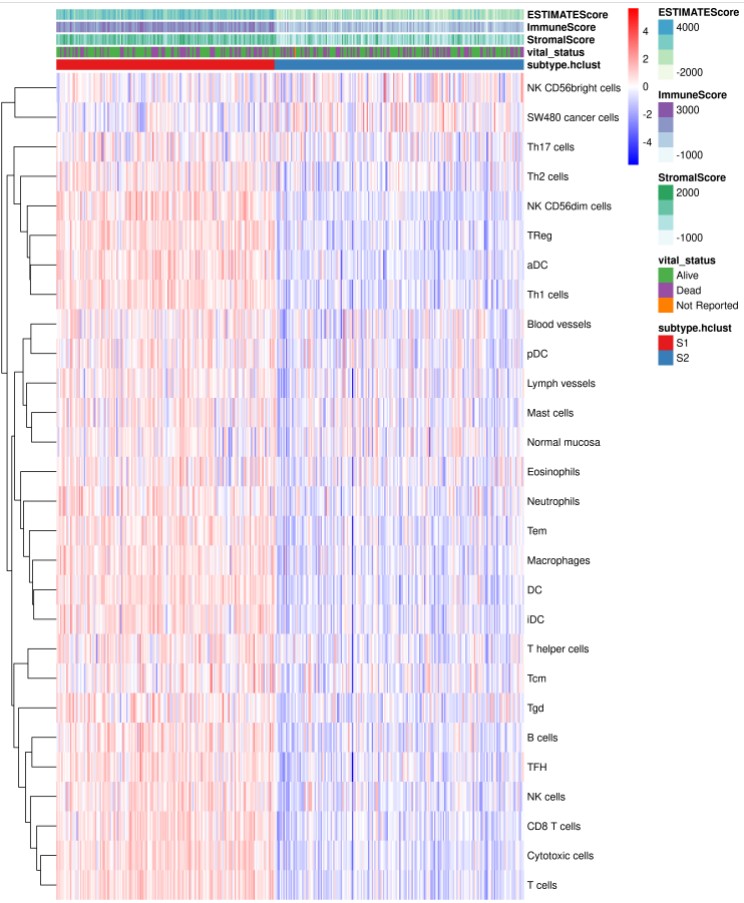
heatmap_group_plot.r 分组热图展示免疫侵润结果
heatmap_group_plot.r 分组热图展示免疫侵润结果
使用参数说明:
$ Rscript   heatmap_group_plot.r -h
usage:  heatmap_group_plot.r [-h] -i filepath -m
                                                          filepath -g group
                                                          [group ...]
                                                          [-l filepath]
                                                          [-t topnumber]
                                                          [--scale SCALE]
                                                          [--log2]
                                                          [--cluster_rows]
                                                          [--cluster_cols]
                                                          [--show_rownames]
                                                          [--show_colnames]
                                                          [-c color [color ...]]
                                                          [-o outdir]
                                                          [-p prefix]
                                                          [-H height]
                                                          [-W width]
plot heatmap
optional arguments:
  -h, --help            show this help message and exit
  -i filepath, --input filepath
                        input the immune res data,[required]
  -m filepath, --metadata filepath
                        input metadata file path[required]
  -g group [group ...], --group group [group ...]
                        input group id in metadata file, can set multi
                        groups[required]
  -l filepath, --genelist filepath
                        gene list file to keep [default NULL]
  -t topnumber, --top topnumber
                        The top var to plot [default NULL]
  --scale SCALE         character indicating if the values should be centered
                        and scaled in either the row direction or the column
                        direction, or none. Corresponding values are "row",
                        "column" and "none" [default="row"]
  --log2                whether do log2 transfrom [optional, default: False]
  --cluster_rows        whether cluster_rows [optional, default: False]
  --cluster_cols        whether cluster_cols [optional, default: False]
  --show_rownames       whether show_rownames [optional, default: False]
  --show_colnames       whether show_colnames [optional, default: False]
  -c color [color ...], --color color [color ...]
                        color map of heatmap, give three color
                        [default=c('blue', 'white', 'red')
  -o outdir, --outdir outdir
                        output file directory [default cwd]
  -p prefix, --prefix prefix
                        out file name prefix [default demo]
  -H height, --height height
                        the height of pic inches [default 9]
  -W width, --width width
                        the width of pic inches [default 10]
参数说明:
结果展示:
注意事项:
样本分组 metadata文件中,不要有NA值;不然会报错:
Error in names(ann_colors[[opt$group[i]]]) <- unique(mygroup) :
  'names' attribute [12] must be the same length as the vector [11]
- 发表于 2021-06-22 09:54
- 阅读 ( 3281 )
- 分类:TCGA
