barplot()R语言绘制状图
barplot()R语言绘制状图
数据:
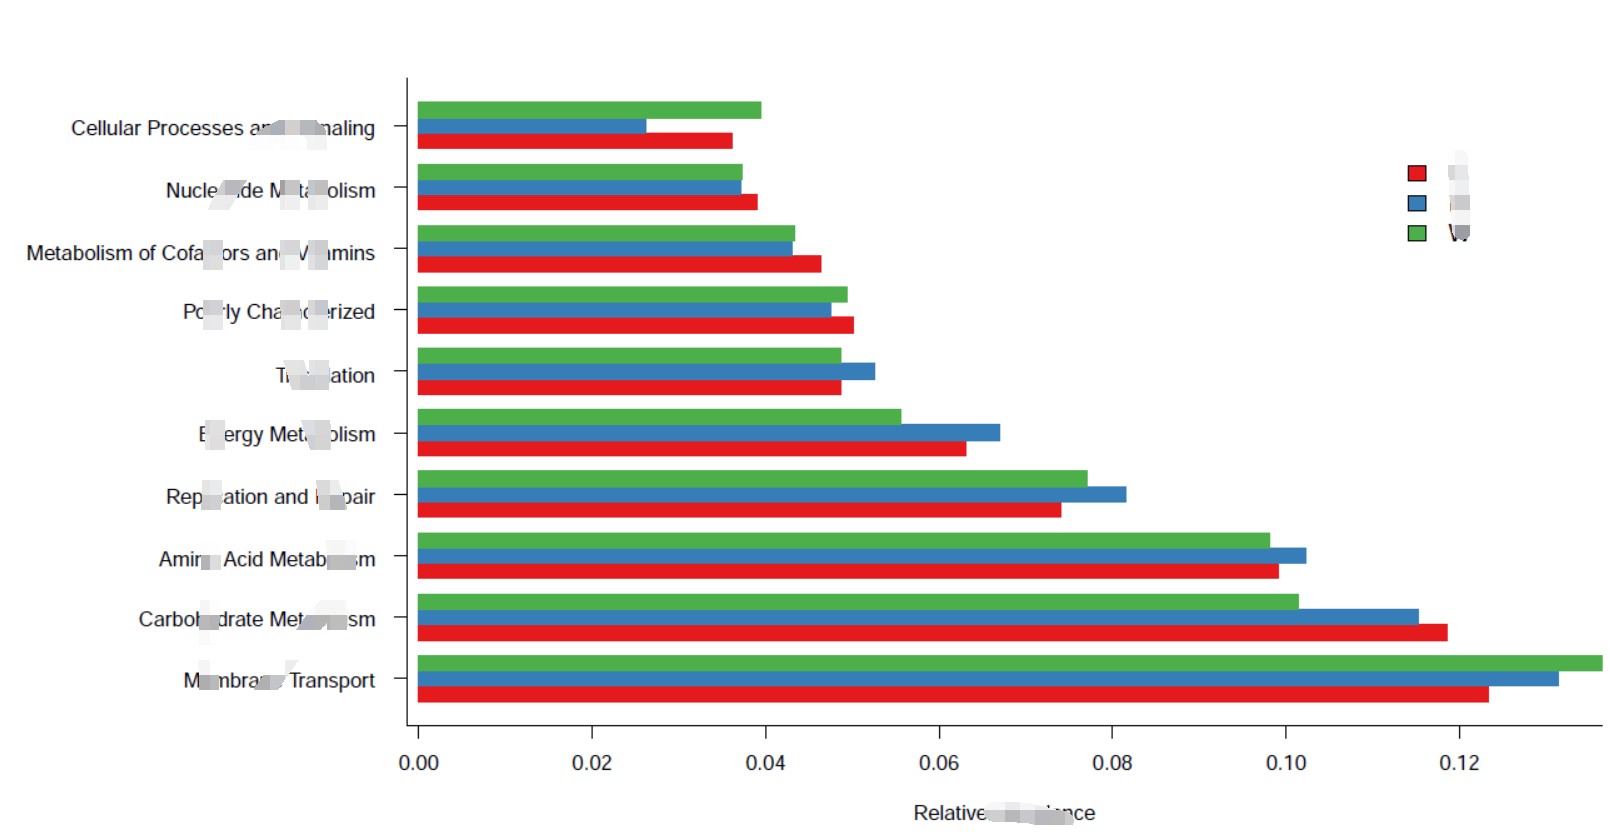
OTU IDCRW
Membrane Transport0.1232550610.1314609080.136381709
Carbohydrate Metabolism0.1185871220.1152349450.101467081
Amino Acid Metabolism0.0990784610.1023070980.098133001
Replication and Repair0.0640276080.081496790.077107142
Energy Metabolism0.0630605790.0669996830.055660175
Translation0.0486662250.0525558320.048639947
Poorly Characterized0.0501483020.0474659650.049391479
Metabolism of Cofactors and Vitamins0.0463398870.0430211620.043328055
Nucleotide Metabolism0.0390221580.0371012490.037240203
Cellular Processes and Signaling0.0360890060.0262093820.039451668
绘图代码
d<-read.table("data.txt",header = T,row.names = 1,sep="\t")
d<-as.matrix(t(d))
barplot(d)
box("l")
pdf(file = "bar.pdf",h=7,w=14)
cc=c("#e41a1c","#377eb8","#4daf4a")
par(mar=c(5,20,4,2))
p=barplot(d,beside = TRUE,width = 1,xlab = "Relative abundance",bty = "n", col = cc,border = NA,horiz = T,xaxs="i",names.arg = NULL,axisnames=F)
legend("topright",legend = rownames(d),
       fill = cc,
       bty='n',xpd=T,inset = 0.1,cex = 1.2)
axis(side = 2, at = p[2,],labels =F)
text(y=p[2,]-0.25, x=-0.005, labels=colnames(d),cex=1,  xpd=TRUE, adj=1)
#text(0.1,0.2,labels = "sss")
box(bty="l")
dev.off()
绘图结果:
- 发表于 2020-03-04 21:26
- 阅读 ( 3726 )
- 分类:R
