python代码到pubmed上搜索关键字,统计每年发文章数量
python代码到pubmed上搜索关键字,统计每年发文章数量
代码如下:
from Bio import Entrez
import time
import pandas as pd
import matplotlib.pyplot as plt
from concurrent.futures import ThreadPoolExecutor, as_completed
# 设置你的邮箱(NCBI 要求)
Entrez.email = "your_email@example.com"
Entrez.tool = "PubMedYearStatsTool"
def search_pubmed(keyword, retmax=10000):
print(f"Searching PubMed for '{keyword}'...")
handle = Entrez.esearch(db="pubmed", term=keyword, retmax=retmax, datetype="pdat")
record = Entrez.read(handle)
id_list = record["IdList"]
print(f"Found {len(id_list)} articles.")
return id_list
def fetch_summary_batch(article_ids):
"""获取一个批次的摘要信息"""
try:
handle = Entrez.esummary(db="pubmed", id=",".join(article_ids), retmode="xml")
summaries = Entrez.read(handle)
time.sleep(0.5) # 控制请求频率
return summaries
except Exception as e:
print(f"Error fetching batch: {e}")
return []
def fetch_all_summaries(id_list, batch_size=200):
"""并发获取所有摘要信息"""
batches = [id_list[i:i + batch_size] for i in range(0, len(id_list), batch_size)]
all_summaries = []
with ThreadPoolExecutor(max_workers=4) as executor: # 最多并发 4 个线程
future_to_batch = {executor.submit(fetch_summary_batch, batch): batch for batch in batches}
for future in as_completed(future_to_batch):
summaries = future.result()
if summaries:
all_summaries.extend(summaries)
return all_summaries
def extract_years(summaries):
year_count = {}
for summary in summaries:
try:
pub_date = summary.get("PubDate", "")
if pub_date:
year = pub_date.split(" ")[0][:4] # 提取前四位作为年份
if year.isdigit() and len(year) == 4:
year_int = int(year)
if 2015 <= year_int <= 2025: # 只保留 2015 - 2025 的数据
year_count[year] = year_count.get(year, 0) + 1
except Exception as e:
continue
return year_count
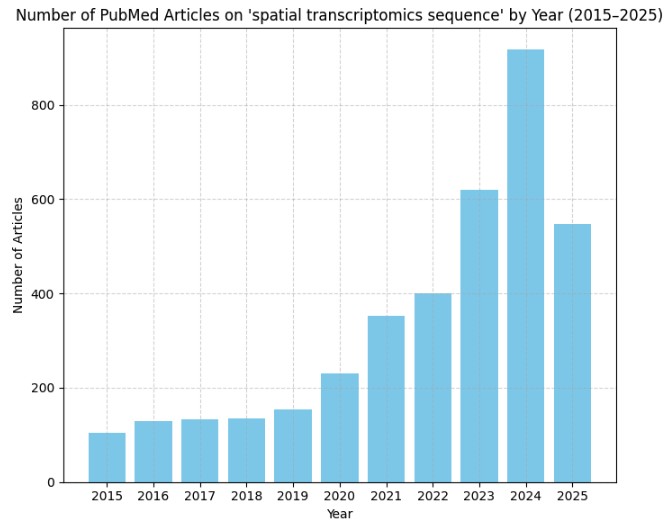
def plot_yearly_trend(year_count, keyword):
df = pd.DataFrame.from_dict(year_count, orient='index', columns=['Count'])
df.index = df.index.astype(int)
df.sort_index(inplace=True)
# 过滤 2015 - 2025
df = df[(df.index >= 2015) & (df.index <= 2025)]
plt.figure(figsize=(7, 6))
plt.bar(df.index, df['Count'], color='skyblue')
plt.title(f"Number of PubMed Articles on '{keyword}' by Year (2015–2025)")
plt.xlabel('Year')
plt.ylabel('Number of Articles')
plt.xticks(range(2015, 2026))
plt.grid(True, linestyle='--', alpha=0.5)
plt.tight_layout()
plt.show()
def main():
keyword = input("Enter your search keyword: ")
id_list = search_pubmed(keyword, retmax=10000)
print("Fetching metadata (summary)...")
summaries = fetch_all_summaries(id_list)
print("Extracting publication years (2015–2025)...")
year_count = extract_years(summaries)
print("\nArticles per year (2015–2025):")
for year in sorted(year_count):
print(f"{year}: {year_count[year]}")
plot_yearly_trend(year_count, keyword)
if __name__ == '__main__':
main()
结果:
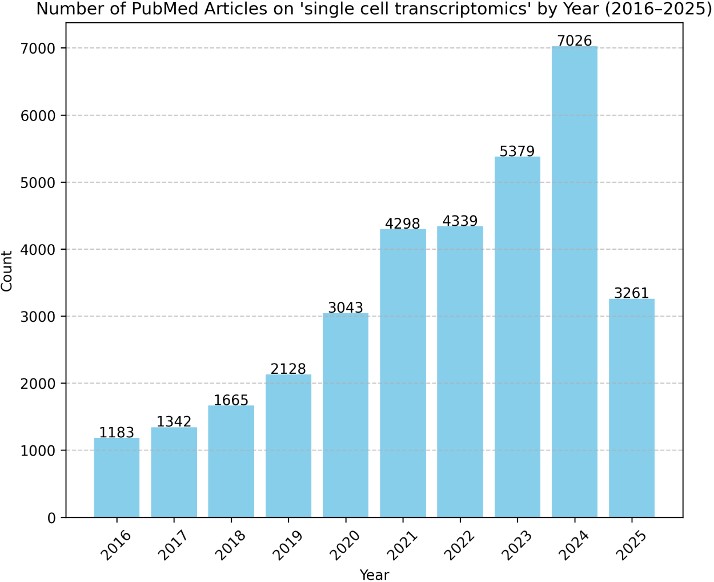
手动绘制:
import pandas as pd
import matplotlib.pyplot as plt
# 数据
# data = {
#     'Year': [2025, 2024, 2023, 2022, 2021, 2020],
#     'Count': [1198, 2297, 1571, 962, 733, 502]
# }

data = {
    'Year': [2025, 2024, 2023, 2022, 2021, 2020, 2019, 2018, 2017, 2016],
    'Count': [3261, 7026, 5379, 4339, 4298, 3043, 2128, 1665, 1342, 1183]
}

# 创建 DataFrame
df = pd.DataFrame(data)
# 绘制柱状图
plt.figure(figsize=(7, 6))
bars = plt.bar(df['Year'], df['Count'], color='skyblue')
# 设置标题和坐标轴标签
keyword="single cell transcriptomics"
plt.title(f"Number of PubMed Articles on '{keyword}' by Year (2016–2025)")
plt.xlabel('Year')
plt.ylabel('Count')
# 显示网格线
plt.grid(axis='y', linestyle='--', alpha=0.7)
# 确保所有年份都显示出来
plt.xticks(df['Year'], rotation=45)  # 横轴标签倾斜角度为45度,防止重叠
# 显示数值在柱子上方
for bar in bars:
    yval = bar.get_height()
    plt.text(bar.get_x() + bar.get_width()/2, yval + 10, int(yval), ha='center')
# 自动调整布局,防止标签被截断
plt.tight_layout()
# 显示图表
plt.show()
- 发表于 2025-05-07 17:52
- 阅读 ( 1659 )
- 分类:其他
