r绘图0不在原点的问题
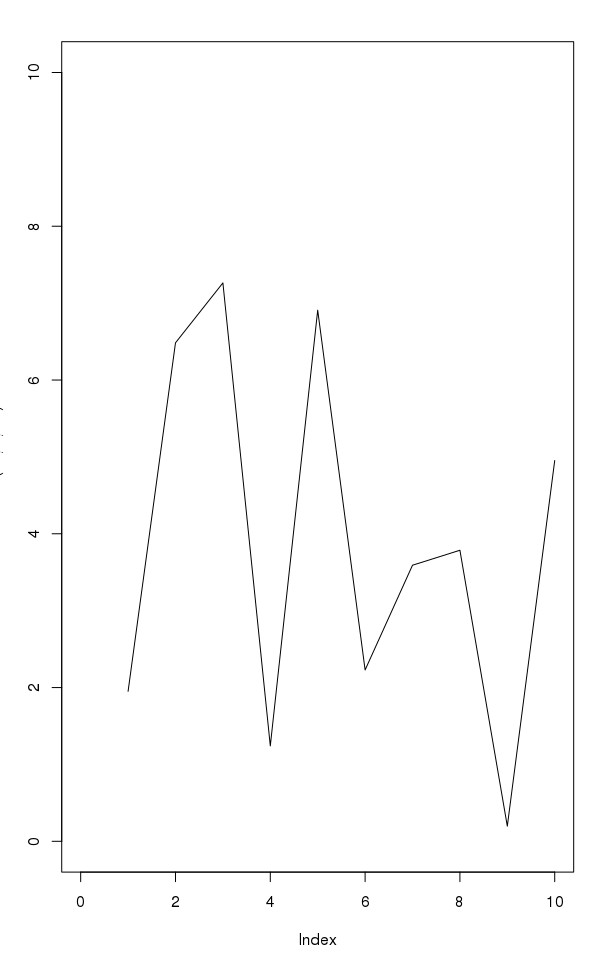
使用plot画图的时候,只是设定xy轴范围仍然在0之前会有一小段多出来的范围
例如:plot(runif(10,0,10),type="l",xlim=c(0,10),ylim=c(0,10))
使用:xaxs/yaxs="i" 代码即可解决
例如:plot(r...
使用plot画图的时候,只是设定xy轴范围仍然在0之前会有一小段多出来的范围
例如:plot(runif(10,0,10),type="l",xlim=c(0,10),ylim=c(0,10))
 使用:xaxs/yaxs="i" 代码即可解决
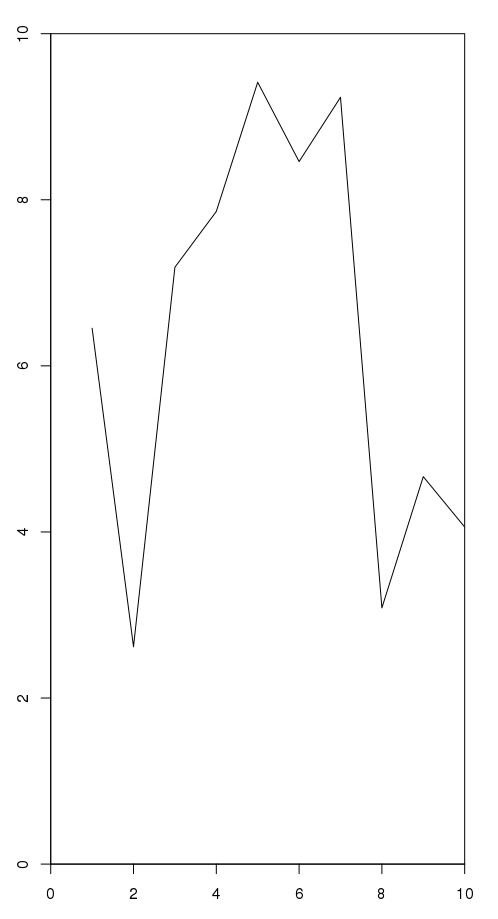
例如:plot(runif(10,0,10),type="l",xlim=c(0,10),ylim=c(0,10),yaxs="i",xaxs="i")
同样,ggplot也会有这个问题,处理方式为在图形p后加一段参数
scale_y_continuous(expand = c(0, 0))+
scale_x_continuous(expand = c(0, 0))
例如ggplot()+
geom_density(aes(x=runif(10,0,10)))+
scale_y_continuous(expand = c(0, 0))+
scale_x_continuous(expand = c(0, 0))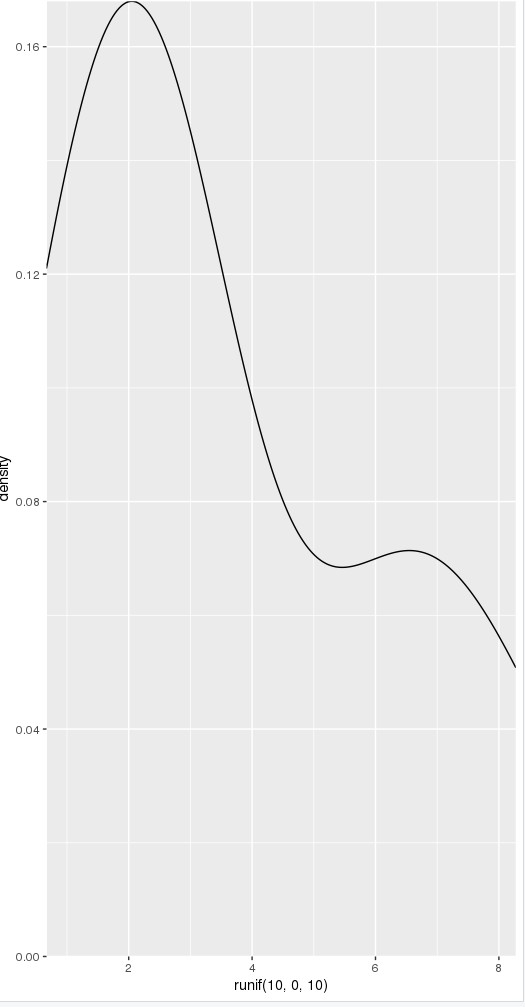
- 发表于 2022-10-21 17:29
- 阅读 ( 3430 )
- 分类:R
