STRING蛋白互作网络图绘制及子网络分析
互作网络是由节点通过彼此之间的相互作用构成,根据节点的不同可以构建蛋白质互作网络,ceRNA网络等,网络中节点参与生物信号传递、基因表达调节、能量和物质代谢及细胞周期调控等生命过程的各个环节,能够系统分析大量基因在生物系统中的相互作用关系,对了解生物系统中各个成分的工作原理,了解疾病等特殊生理状态下生物信号和能量物质代谢的反应机制,以及了解基因之间的功能联系都有重要意义。目前在大多数文献中都能看到互作网络的身影,因此绘制一幅精美的互作网络图十分重要。
例如2021年5月发表在Mol Ther Nucleic Acids中的文献《Comprehensive analysis to identify DLEU2L/TAOK1 axis as a prognostic biomarker in hepatocellular carcinoma》,影响因子8.89。作者首先分析PTEN相关的差异基因(lncRNA、mRNA、miRNA),接着通过各种数据库来分析预测基因之间的相互作用来构建ceRNA网络。
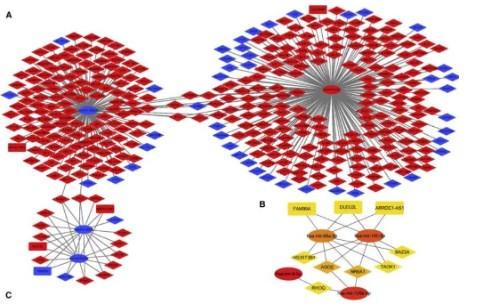
互作网络的绘制
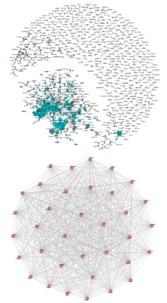
为了使大家能更简便快捷地绘制出精美的互作图,这里我们给大家提供一个绘制网络图的R脚本,这个脚本只需要准备好相应的输入文件,再进行简单的命令行操作即可绘制可直接用于文章发表的网络图,并且同时提取网络的最大子图,输出构成最大子图的节点并绘制子图网络。
使用命令:
Rscript network.r -e S1_vs_S2.gene_network.tsv -v S1_vs_S2.ID_info_table.tsv -f fromGeneName -t toGeneName -w combined_score -g regulate
结果展示:
输入文件准备
这个脚本所必需的输入文件有两个。
第一个文件为边数据,文件中包含边的起始节点,结尾节点,以及边的一些属性;(格式如下表)
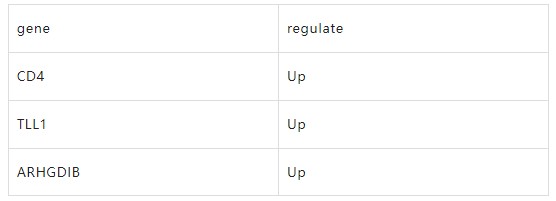
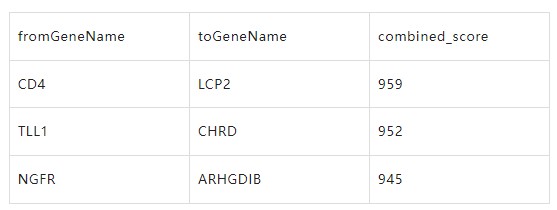 第二个文件为节点数据,文件中包含节点(节点名与边数据文件中起始节点名,结尾节点名相对应)和节点属性信息。
更多脚本参数设置及说明
通过-h参数获得以下帮助信息。
usage: network.r [-h] -e filepath -v filepath -f from -t to -w weight -g group
                 [--isolated] [-l style] [--label.node] [--sub_label.node]
                 [-o path] [-n prefix] [-H number] [-W number]

network plot:https://www.omicsclass.com/article/1531

optional arguments:
  -h, --help            show this help message and exit
  -e filepath, --edge filepath
                        input the edge information of network,[required]
  -v filepath, --vertex filepath
                        input the vertex information of network,[required]
  -f from, --from from  the name of the start gene column [required]
  -t to, --to to        the name of the end gene column[required]
  -w weight, --combined_score weight
                        the name of the edge weight column[required]
  -g group, --group group
                        input group id in vertex file, can set multi groups[required]
  --isolated            delete isolated vertex [optional, default: False]
  -l style, --layout style
                        set Network display style,c('star', 'circle', 'gem',
                        'dh', 'graphopt', 'grid', 'mds', 'randomly', 'fr',
                        'kk', 'drl', 'lgl'),[default fr]
  --label.node          show node name [optional, default: TRUE]
  --sub_label.node      show node name of sub-network [optional, default:TRUE]
  -o path, --outdir path
                        output file directory [default cwd]
  -n prefix, --name prefix
                        out file name prefix [default demo]
  -H number, --height number
                        the height of pic inches [default 12]
  -W number, --width number
                        the width of pic inches [default 12]
必需参数
-e 网络图的边信息文件路径
-v 网络中节点信息文件路径
-f 边信息文件中起始节点列名
-t 边信息文件中结尾节点列名
-w 边信息文件中边权重列名,用于调整网络边的粗细
-g 节点信息文件中节点类别列名,用于节点着色
其他参数
-i 网络图中是否隐藏孤立节点,默认不隐藏
-L 是否标注完整网络的节点名,默认标注
-S 是否标注最大子图中节点名,默认标注
-o 输出文件存放路径,默认为当前路径
-n 文件名,默认demo
-H、-W 输出图片长宽,单位inch,默认均为12
脚本获取方法
在本公众号回复network即可获得网络图绘制脚本的网盘链接以及提取码。
如何使用命令行的方法分析数据
可能有的人没有用过命令的形式分析数据, 可以学习下面的课程入门一下:

延伸阅读

- 发表于 2022-06-15 16:34
- 阅读 ( 6205 )
- 分类:R
