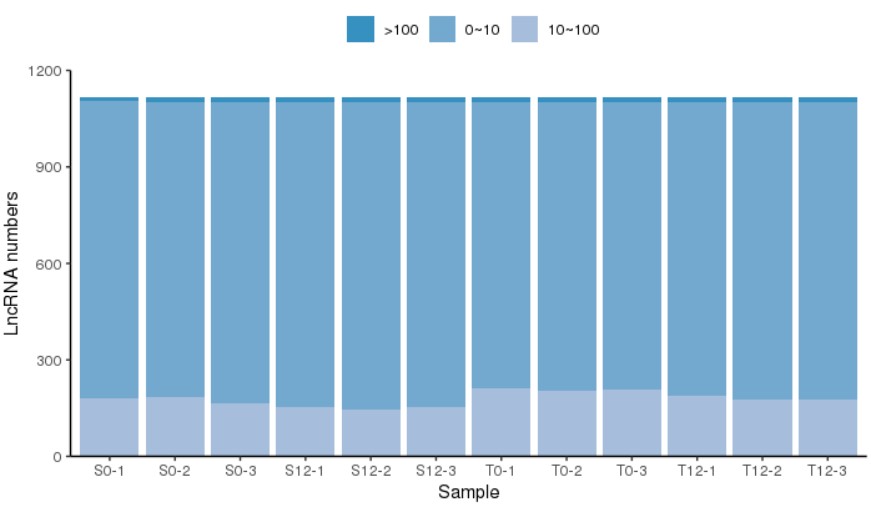
绘制展示基因在样本中表达量与数量的柱状图
ggplot2包绘制了展示基因在样本中表达量与数量的柱状图
使用方法:
Rscript lnc_exp.r -h
usage: lnc_exp.r [-h] -i exp_data [-l legend.position] [-o outdir] [-p prefix]
                 [-H height] [-W width]

lnc_exp_Histogram:https://www.omicsclass.com/article/1552

optional arguments:
  -h, --help            show this help message and exit
  -i exp_data, --exp_data exp_data
                        input data file path[required]
  -l legend.position, --legend.position legend.position
                        Sets the location of the
                        legend[none,left,right,bottom,top,or two-element
                        numeric vector][optional,default top]
  -o outdir, --outdir outdir
                        output file directory[optional,default cwd]
  -p prefix, --prefix prefix
                        out file name prefix[optional,default lncRNA]
  -H height, --height height
                        the height of the heat map[optional,default 5]
  -W width, --width width
                        the width of the heat map[optional,default 5]
参数说明:
-i 输入基因表达矩阵文件,建议输入标准化过后的表达数据
| #ID | S0-1 | S0-2 | S0-3 | S12-1 | S12-2 | S12-3 | T0-1 | T0-2 |
| XLOC_000173 | 0.249352 | 0.1533 | 0.499899 | 0.258562 | 0.174361 | 0.659209 | 0.647131 | 0.705749 |
| XLOC_000195 | 0.0500286 | 0.029918 | 0 | 0.0674263 | 0 | 0 | 0.0682668 | 0.0121699 |
| XLOC_000196 | 0.458015 | 0.938447 | 0.72592 | 0.28384 | 0.271833 | 0.316445 | 0.742948 | 0.744104 |
-l 指定图例的位置,可以设置成none,left,right,bottom,top,or two-element numeric vector
使用举例:
Rscript lnc_exp.r -i All_lnc_gene_fpkm.tsv -l top -p lnc_exp_Histogram
结果展示:

- 发表于 2021-09-17 17:08
- 阅读 ( 4738 )
- 分类:R
你可能感兴趣的文章
- 不均等坐标系绘制 2301 浏览
- ggplot 柱状图,y轴从0 开始,最高柱子 留有余地代码: 2932 浏览
- cnv_dumbbell_plot.r 绘制哑铃图ggplot2包 3235 浏览
- ggplot中用字符窜传递变量名称列名等 2982 浏览
- ggplot2中各种主题元素修改对应方法函数速查表 5163 浏览
0 条评论
请先 登录 后评论
