WGCNA 中Relationship between module eigengenes图片绘制--plotMEpairs函数
前几天遇到一张图,https://www.omicsclass.com/question/214。
百思不得其"姐”,功力有限,查了查官网教程 :
参考链接文件:https://horvath.genetics.ucla.edu/html/CoexpressionNetwork/Rpackages/WGCNA/Tutorials/Simulated-06-RelatingToExt.pdf
#########################################
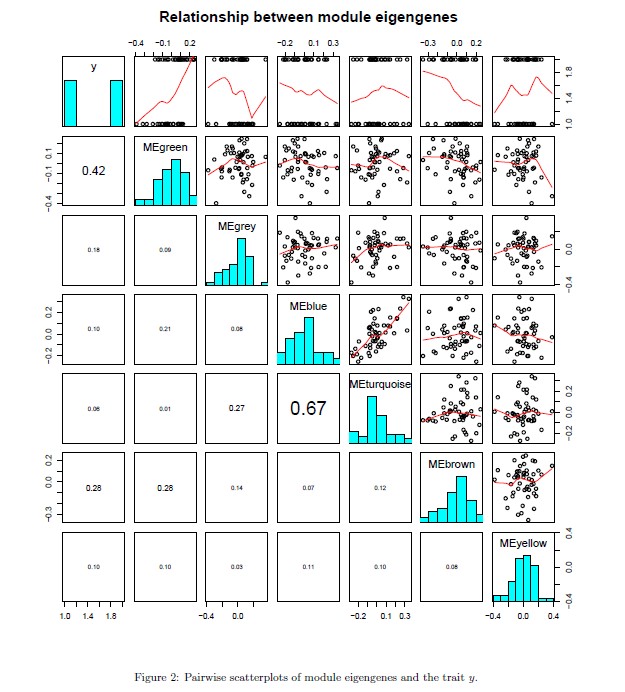
The plots is shown in Fig. 2. The module eigengenes (rst PC) of different modules may be highly correlated.
WGCNA can be interpreted as a biologically motivated data reduction scheme that allows for dependency between
the resulting components. In contrast, principal component analysis imposes orthogonality between the components.
Since modules may represent biological pathways there is no biological reason why modules should be orthogonal to
each other.
#######################################################
图片实现过程利用的函数为WGCNA 包所带的plotMEpairs(),具体参数如下:
The function produces a matrix of plots containing pairwise scatterplots of given eigengenes, the distribution of their values and their pairwise correlations.
plotMEpairs(
   datME,
   y = NULL,
   main = "Relationship between module eigengenes",
   clusterMEs = TRUE,
   ...)
| datME | a data frame containing expression data, with rows corresponding to samples and columns to genes. Missing values are allowed and will be ignored. |
| y | optional microarray sample trait vector. Will be treated as an additional eigengene. |
| main | main title for the plot. |
| clusterMEs | logical: should the module eigengenes be ordered by their dendrogram? |
| ... | additional graphical parameters to the function pairs |
根据参数解释,可知datME对应WGCNA分析过程中的模块特征向量矩阵 MEs,行对应样品,列对应模块,y为可选设置,如若添加则作为额外的特征向量,与MEs一同整合分析。
同时结合教程可知,y可以作为一个包含各样品某一性状的数组向量,参与分析,从而分析该性状和各模块之间的关系。
通过获得MEs
运行代码画图代码:
head(MEs)
dim(MEs)
sizeGrWindow(9, 8)
plotMEpairs(MEs)
获得结果,可知共24各样品,13个有效模块,加上灰色共14类,结果图片构成14 X14 的矩阵
> head(MEs)
      MEbrown    MEgrey60 MEdarkgreen     MEgreen MElightgreen MEgreenyellow MEmidnightblue
1 -0.02732667 -0.18005068  0.04909099 -0.09335227 -0.233347243     0.2133176     0.08117237
2 -0.04028053 -0.09128518 -0.24261718 -0.14310115 -0.245231479     0.2364185     0.14968563
3 -0.05871098 -0.16185212 -0.18909061 -0.09690140 -0.199610380     0.2083338     0.15720446
4 -0.12792499 -0.13619485 -0.03695876 -0.03912234 -0.005802218    -0.1439151    -0.12938109
5 -0.13103096 -0.11406024 -0.12186421 -0.05727322 -0.044612032    -0.1216559    -0.12238667
6 -0.12946137 -0.12875634 -0.04806007 -0.05393726 -0.031404975    -0.1387283    -0.13821191
    MEsalmon     MEblack       MEblue       MEpink MElightcyan MEroyalblue      MEgrey
1 0.42779045 -0.18089620 -0.080302588 -0.001740971 -0.09027922   0.1194729 -0.40484698
2 0.38949996 -0.09663047 -0.129981362 -0.023147821 -0.06855325   0.2030699 -0.08077918
3 0.43843422 -0.18078785 -0.178918524  0.074065819  0.03001557   0.3884039  0.24425233
4 0.07662589 -0.14671194 -0.069620805  0.251434368  0.57695019   0.4252789  0.28913480
5 0.11483566 -0.13031815 -0.025252279  0.225316624  0.52828545   0.4033430 -0.02300266
6 0.06110416 -0.13676978  0.003239324  0.230963627  0.41886995   0.3178563 -0.15904579
> dim(MEs)
[1] 24 14
> sizeGrWindow(9, 8)
NULL
> plotMEpairs(MEs)
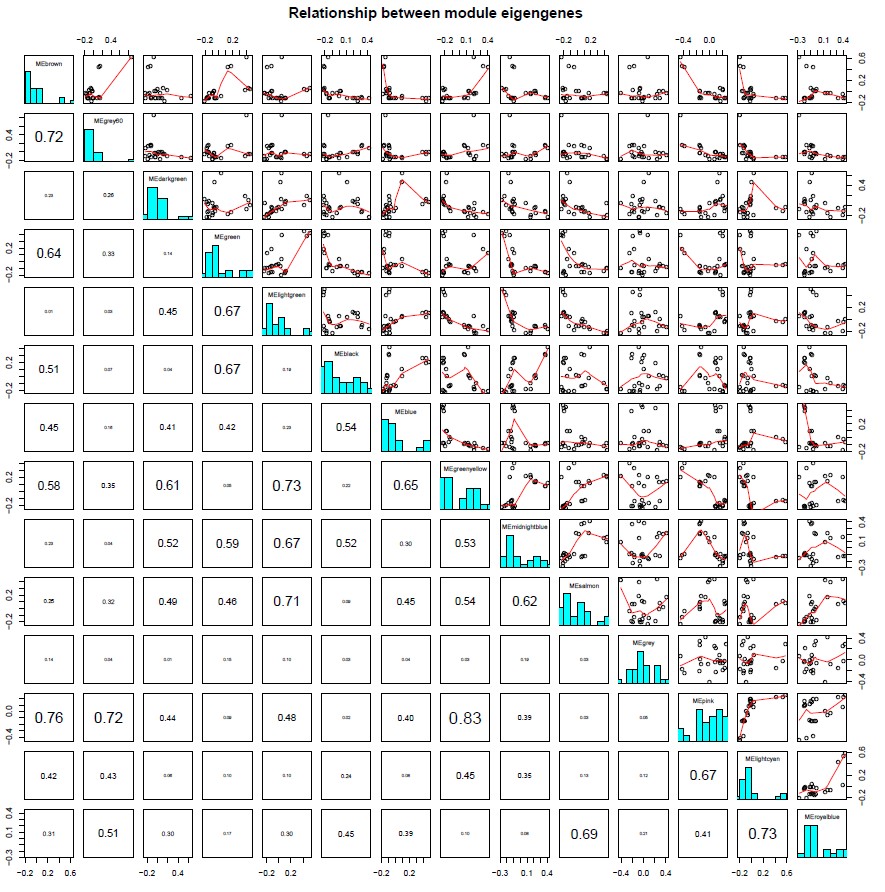 图片中左下具体数据表示各模块特征特征向量间相关性大小情况,数值愈大,字体也越大。外围数字为坐标。
此外可以设置一个性状数据,统计每个样品的性状情况,形成一个数组向量,向量长度和样品数一致,一一对应,则可以结合性状进行分析,譬如:
> trait
 [1] 1 2 3 4 5 2 3 4 5 1 2 3 4 1 5 2 3 1 1 1 1 1 2 3
> sizeGrWindow(9, 8)
NULL
> plotMEpairs(MEs,y=trait)
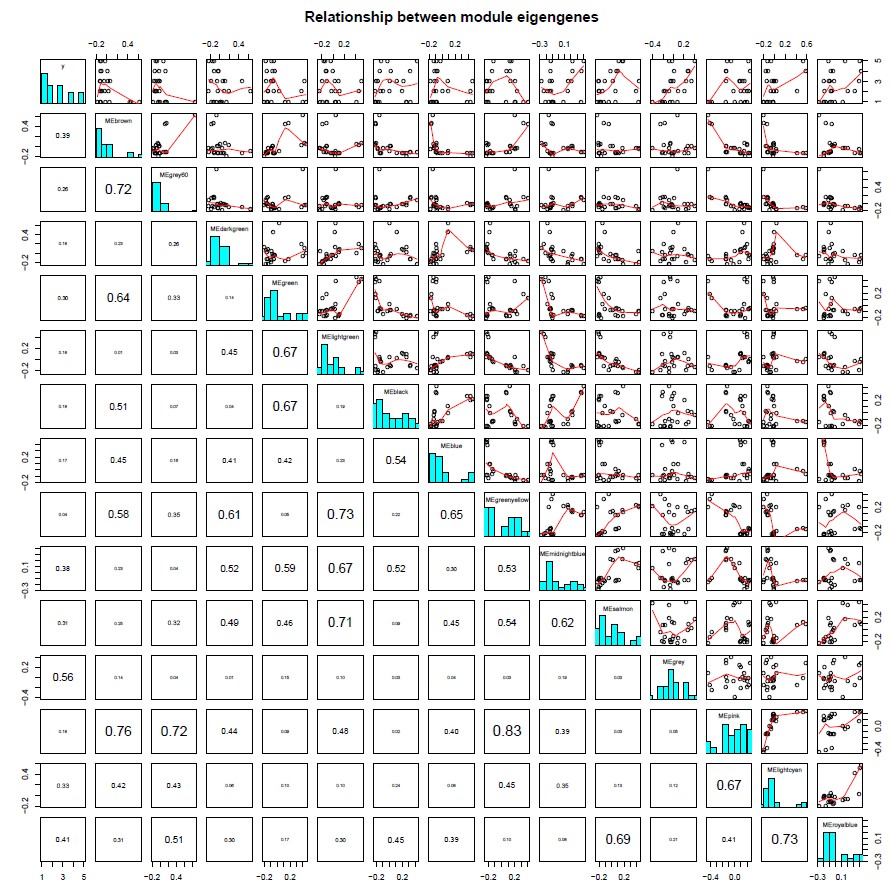
图片结果中的第一行,第一列,则是性状数据与各模块的分析结果。
属于一句代码的骚操作 ~(^ -^)~
参考课程:《WGCNA-加权基因共表达网络分析》数据分析
如果想提升自己的绘图技能,我们推荐:R语言绘图基础(ggplot2)
更多生物信息课程:
1. 文章越来越难发?是你没发现新思路,基因家族分析发2-4分文章简单快速,学习链接:基因家族分析实操课程、基因家族文献思路解读
2. 转录组数据理解不深入?图表看不懂?点击链接学习深入解读数据结果文件,学习链接:转录组(有参)结果解读;转录组(无参)结果解读
3. 转录组数据深入挖掘技能-WGCNA,提升你的文章档次,学习链接:WGCNA-加权基因共表达网络分析
4. 转录组数据怎么挖掘?学习链接:转录组标准分析后的数据挖掘、转录组文献解读
5. 微生物16S/ITS/18S分析原理及结果解读、OTU网络图绘制、cytoscape与网络图绘制课程
6. 生物信息入门到精通必修基础课:linux系统使用、perl入门到精通、perl语言高级、R语言入门、R语言画图
7. 医学相关数据挖掘课程,不用做实验也能发文章:TCGA-差异基因分析、GEO芯片数据挖掘、GEO芯片数据标准化、GSEA富集分析课程、TCGA临床数据生存分析、TCGA-转录因子分析、TCGA-ceRNA调控网络分析
8.其他,二代测序转录组数据自主分析、NCBI数据上传、二代测序数据解读
- 发表于 2018-08-31 13:42
- 阅读 ( 6902 )
- 分类:WGCNA
