遗传图绘制:
遗传图绘制代码演示
代码参考:https://cran.r-project.org/web/packages/LinkageMapView/vignettes/LinkageMapView.html
library(LinkageMapView)
#示例数据
data(carrot)
head(carrot)
carrot=carrot[order(carrot$group),]
outfile="genetic_map_ruler.pdf"
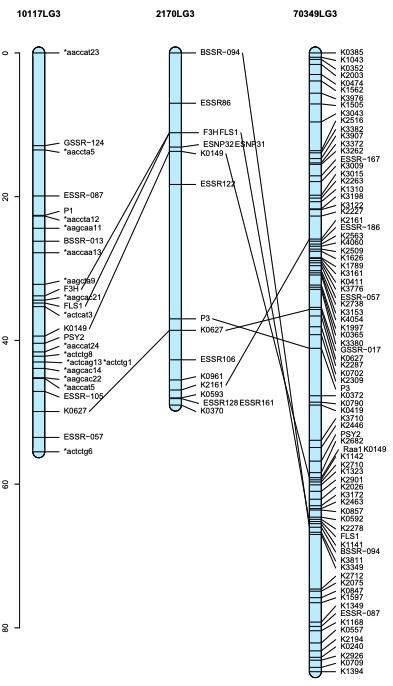
lmv.linkage.plot(carrot,outfile,ruler = TRUE,lg.col = "lightblue1")
outfile="genetic_map_noruler.pdf"
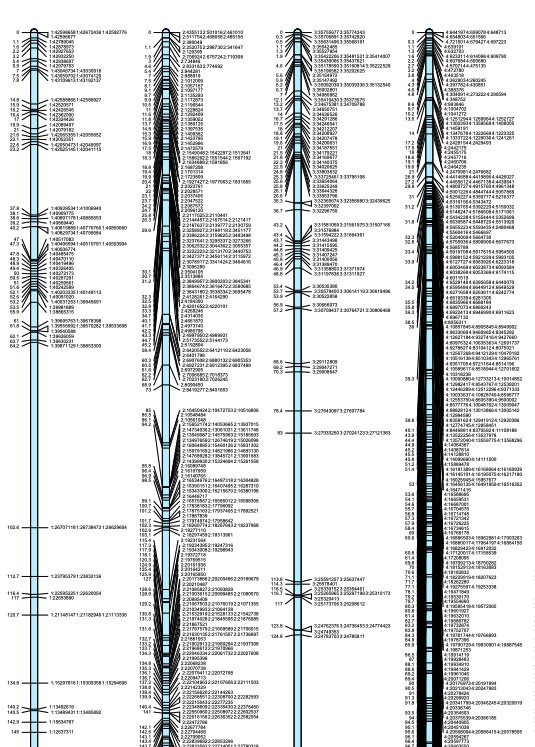
lmv.linkage.plot(carrot,outfile,ruler = F,lg.col = "lightblue1")
## draw tickmarks at each cM from 0 to largest position of linkage groups to be drawn
maxpos <- floor(max(carrot$position))
at.axis <- seq(0, maxpos)
## put labels on ruler at every 10 cM
axlab <- vector()
for (lab in 0:maxpos) {
if (!lab %% 10) {
axlab <- c(axlab, lab)
}
else {
axlab <- c(axlab, NA)
}
}
outfile="genetic_map.pdf"
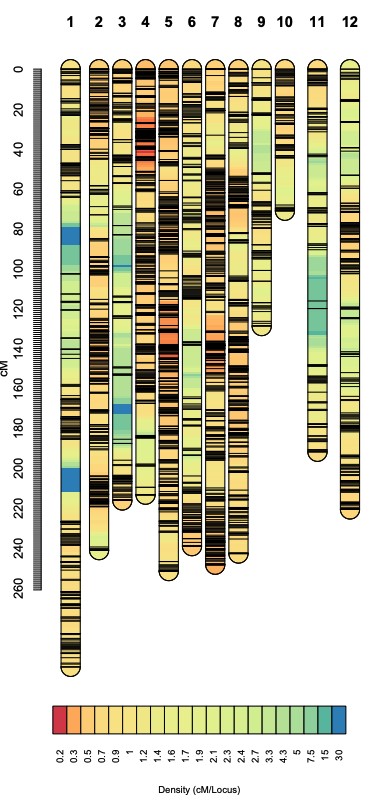
lmv.linkage.plot(carrot,outfile,denmap=TRUE, cex.axis = 1, at.axis = at.axis, labels.axis = axlab)
有标尺
无标尺
热图
- 发表于 2024-02-22 15:59
- 阅读 ( 2233 )
- 分类:遗传进化
