老师,您好,请问按照vegan包绘制物种累积曲线的时候,最后得不到图的结果,而得出以下内容:
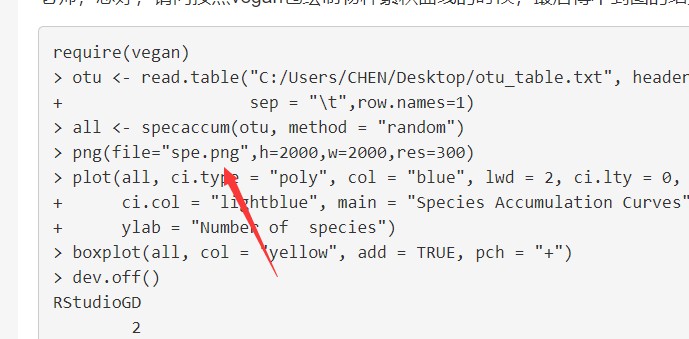
require(vegan)
> otu <- read.table("C:/Users/CHEN/Desktop/otu_table.txt", header = T,
+                   sep = "\t",row.names=1)
> all <- specaccum(otu, method = "random")
> png(file="spe.png",h=2000,w=2000,res=300)
> plot(all, ci.type = "poly", col = "blue", lwd = 2, ci.lty = 0,
+      ci.col = "lightblue", main = "Species Accumulation Curves", xlab = "Number of samples",
+      ylab = "Number of  species")
> boxplot(all, col = "yellow", add = TRUE, pch = "+")
> dev.off()
RStudioGD
        2
不知道是什么原因