maftools|突变数据可视化-瀑布图绘制及脚本使用
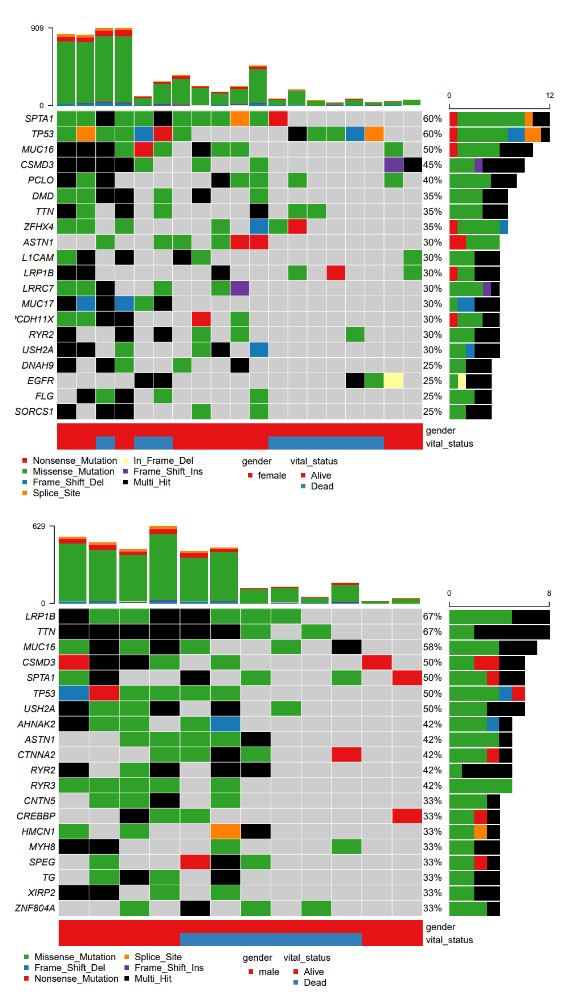
随着肿瘤基因组学的发展,突变注释格式(MAF)正被广泛接受并用于存储体细胞变异情况。由体细胞变异组成的结果数据以突变注释格式存储。只要数据为MAF格式,maftools包便可以高效的方式汇总、分析、注释和可视化。这次主要介绍使用maftools包绘制组学突变结果(MAF)的oncoplot(瀑布图)。瀑布图可直观展示多个维度的数据,对于组学突变分析结果的展示比较有优势,肿瘤相关的文章使用这种图也十分常见。
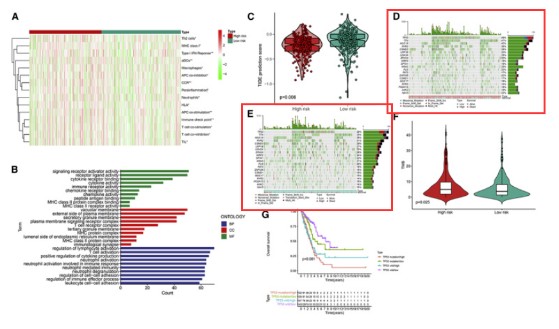
比如2021年发表在Mol Ther Nucleic Acids上的文章《m6A-related lncRNAs are potential biomarkers for predicting prognoses and immune responses in patients with LUAD》(IF=8.89),作者采用TCGA的体细胞突变数据通过绘制瀑布图来直观展示生存预后高低风险组之间的突变差异。
突变数据可视化及瀑布图的绘制
为了使大家能更简便快捷地绘制出精美的突变数据瀑布图,这里我们给大家提供一个绘制瀑布图的R脚本,这个脚本只需要准备好相应的输入文件,再进行简单的命令行操作即可绘制可直接用于文章发表的瀑布图。
使用命令:
Rscript maf_oncoplot.r -i TCGA-LUAD.maf_maftools.maf  -m LUAD_metadata_risk_score_tmb.tsv\
 -g gender -a gender vital_status -p LUAD_mutation
输入文件准备
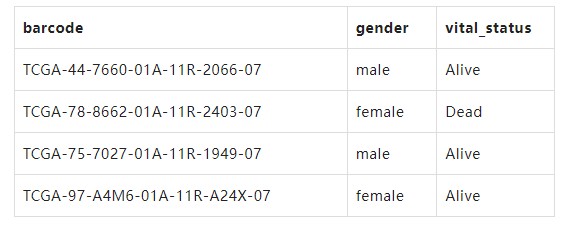
这个脚本所必需的输入文件有两个,一个maf数据,这个文件十分简单,并且不需要任何处理,只需数据符合为maf格式即可;第二个文件为临床特征数据,其中包含每个样本的一些分类数据,可用于分类绘制瀑布图或在瀑布图中添加分类信息。
文件一:可直接在TCGA数据库中下载,这里给大家提供一个R脚本来直接从TCGA下载maf数据。
使用命令:
参数说明通过-h查看
Rscript tcga_maf_download.r -h
usage: tcga_maf_download.r [-h] -p project [-P pipelines]
                                     [-o outdir] [-H height] [-W width]


optional arguments:
  -h, --help            show this help message and exit
  -p project, --project project
                        input project ID of TCGA, for example TCGA-STAD,more
                        project ID:https://www.omicsclass.com/article/1061
                        [required]
  -P pipelines, --pipelines pipelines
                        Four separate variant calling pipelines are
                        implemented for GDC data harmonization. Options: muse,
                        varscan2, somaticsniper, mutect2. For more
                        information: https://gdc-docs.nci.nih.gov/Data/Bioinfo
                        rmatics_Pipelines/DNA_Seq_Variant_Calling_Pipeline/
                        [default mutect2]
  -o outdir, --outdir outdir
                        output file directory [default cwd]
  -H height, --height height
                        the height of pic inches [default 7]
  -W width, --width width
                        the width of pic inches [default 10]
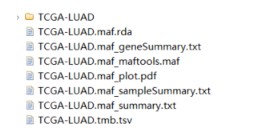
只需指定-p参数,指定所需的TCGA癌症project即可获得相对应的体细胞突变数据。(突变注释文件maf、样本信息、基因信息,tmb值及summary)
文件二:格式如下
更多脚本参数设置及说明
通过-h参数获得以下帮助信息。
Rscript maf_oncoplot.r -h
usage: maf_oncoplot.r [-h] -i maffile -m metadata -g group
                      [-a additive [additive ...]] [-T topgene]
                      [-l genelist [genelist ...]] [-t] [-o outdir]
                      [-p prefix] [-H height] [-W width]

Mutation annotation file classification
visualization:https://www.omicsclass.com/article/1518

optional arguments:
  -h, --help            show this help message and exit
  -i maffile, --maf maffile
                        input the maf file[required]
  -m metadata, --meta metadata
                        input metadata file path[required]
  -g group, --group group
                        input group id in metadata file to classification
                        visualization[required]
  -a additive [additive ...], --additive additive [additive ...]
                        add additional class[optional,default: NULL]
  -T topgene, --top topgene
                        Number of top genes displayed [optional, default: 20]
  -l genelist [genelist ...], --genelist genelist [genelist ...]
                        the selected gene list to display [optional, default:
                        NULL]
  -t, --showtitle       whether show maftools title of plot [optional,
                        default: False]
  -o outdir, --outdir outdir
                        output file directory [default cwd]
  -p prefix, --prefix prefix
                        out file name prefix [default maf]
  -H height, --height height
                        the height of pic inches [default 8]
  -W width, --width width
                        the width of pic inches [default 8]
必需参数
-i 突变数据文件(maf格式)
-m 样本分类数据文本文件
-g 指定metadata 分组列名,如果分组名字有空格,应该用引号引起来
其他参数
-a 附加分组列名,结果将在图中显示
-T 可指定所要展示的top基因个数,默认20
-l 可指定所要展示的基因列表,基因之间用空格隔开,默认NULL
-t 是否给输出结果图添加title,默认False不添加
-o 输出文件存放路径,默认为当前路径
-p 输出文件名,默认maf
-H、-W 输出图片长宽,单位inch,默认均为8
脚本获取方法
在本公众号回复maf_oncoplot即可获得数据下载及瀑布图绘制脚本的网盘链接以及提取码。
如何使用命令行的方法分析数据
可能有的人没有用过命令的形式分析数据, 可以学习下面的课程入门一下:


- 发表于 2022-06-15 14:47
- 阅读 ( 14113 )
- 分类:R
