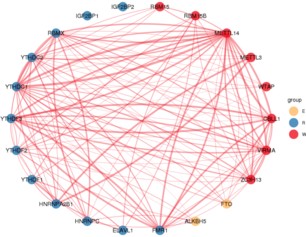
corr_network.r—ggraph包绘制展示相关性的网络图
ggraph包绘制展示相关性的网络图
使用方法:
$Rscript scripts/corr_network.r -h
usage: scripts/corr_network.r [-h] -g GENE_DATA -p P_DATA -r R_DATA
                              [-P P_VALUE] [-R R_VALUE] [-H HEIGHT] [-W WIDTH]
                              [-o OUTDIR] [-f PREFIX]

Network diagram of correlation:https://www.omicsclass.com/article/1574

optional arguments:
  -h, --help            show this help message and exit
  -g GENE_DATA, --gene_data GENE_DATA
                        Enter the file path that contains the gene symbol and
                        gene grouping[required]
  -p P_DATA, --p_data P_DATA
                        input data file path[required]
  -r R_DATA, --r_data R_DATA
                        input data file path[required]
  -P P_VALUE, --P_value P_VALUE
                        P value of correlation[optional,default 0.05]
  -R R_VALUE, --R_value R_VALUE
                        the correlation coefficient[optional,default 0.3]
  -H HEIGHT, --height HEIGHT
                        the height of plot[optional,default 6]
  -W WIDTH, --width WIDTH
                        the width of plot[optional,default 6]
  -o OUTDIR, --outdir OUTDIR
                        output file directory[optional,default cwd]
  -f PREFIX, --prefix PREFIX
                        out file name prefix[optional,default m6a_corr]
参数说明:
-g 输入含有基因名称及基因分组的文件:
| ID | group |
| RBM15 | W |
| RBM15B | W |
| METTL14 | W |
-r 输入相关性分析的R值结果文件:
| YTHDC2 | ELAVL1 | IGF2BP2 | YTHDC1 | ALKBH5 | |
| YTHDC2 | 1 | 0.100844958115642 | -0.199266632575919 | 0.546179408118954 | 0.075091821006311 |
| ELAVL1 | 0.100844958115642 | 1 | 0.150532385539874 | 0.225088605909775 | 0.298942427929541 |
| IGF2BP2 | -0.199266632575919 | 0.150532385539874 | 1 | -0.233843565264036 | -0.172593213718997 |
-p 输入相关性分析的P值结果文件:
| YTHDC2 | ELAVL1 | IGF2BP2 | YTHDC1 | ALKBH5 | |
| YTHDC2 | 0 | 0.0193039987188 | 3.192988377154e-06 | 3.66906551176e-43 | 0.0818330030147 |
| ELAVL1 | 0.0193039987188 | 0 | 0.000459299744619 | 1.315965760206e-07 | 1.43806714122e-12 |
| IGF2BP2 | 3.19298837715e-06 | 0.000459299744619 | 0 | 4.074092694927e-08 | 5.71701876639e-05 |
-P、-R
指定P值和R值的阈值,默认P值为0.05,R值为0.3
使用举例:
Rscript ../scripts/corr_network.r -g ../m6a.tsv -p m6a_corr_p.tsv \
    -r m6a_corr_r.tsv -P 0.001 -R 0.4
结果展示:
- 发表于 2021-10-15 16:04
- 阅读 ( 4792 )
- 分类:R
