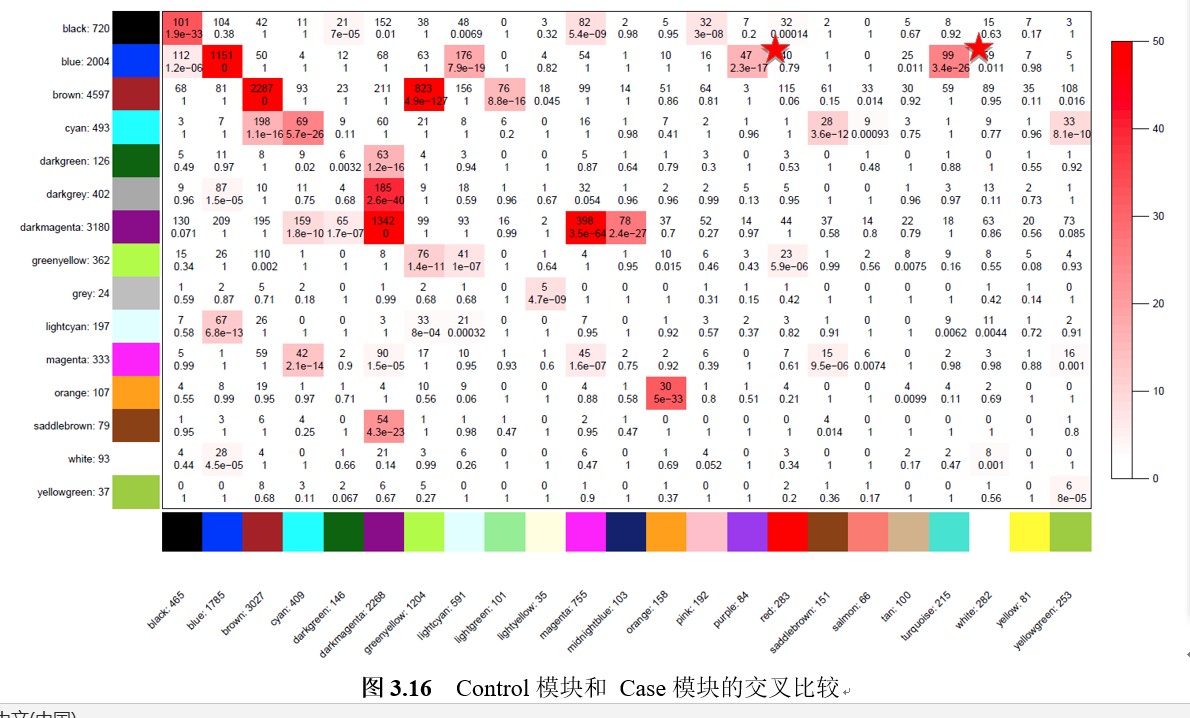
#############################relate modules to external clinical triats######################################
# Define numbers of genes and samples
nGenes = ncol(datExpr0)
nSamples = nrow(datExpr0)
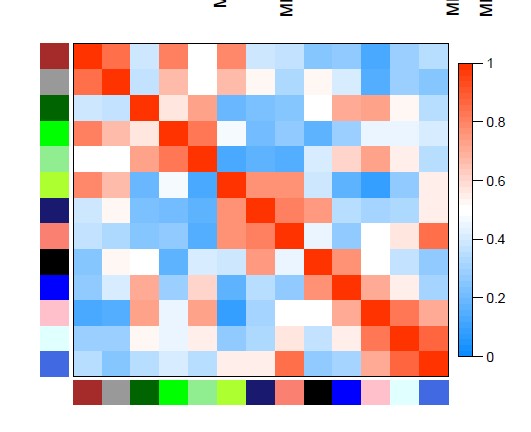
moduleTraitCor = cor(MEs, datTraits, use = "p")
moduleTraitPvalue = corPvalueStudent(moduleTraitCor, nSamples)
sizeGrWindow(10,6)
#pdf(file="8_Module-trait relationships.pdf",width=10,height=6)
# Will display correlations and their p-values
textMatrix = paste(signif(moduleTraitCor, 2), "\n(",
signif(moduleTraitPvalue, 1), ")", sep = "")
dim(textMatrix) = dim(moduleTraitCor)
par(mar = c(6, 8.5, 3, 3))
# Display the correlation values within a heatmap plot
labeledHeatmap(Matrix = moduleTraitCor,
xLabels = names(datTraits),
yLabels = names(MEs),
ySymbols = names(MEs),
colorLabels = FALSE,
colors = greenWhiteRed(50),
textMatrix = textMatrix,
setStdMargins = FALSE,
cex.text = 0.5,
zlim = c(-1,1),
main = paste("Module-trait relationships"))
#dev.off()