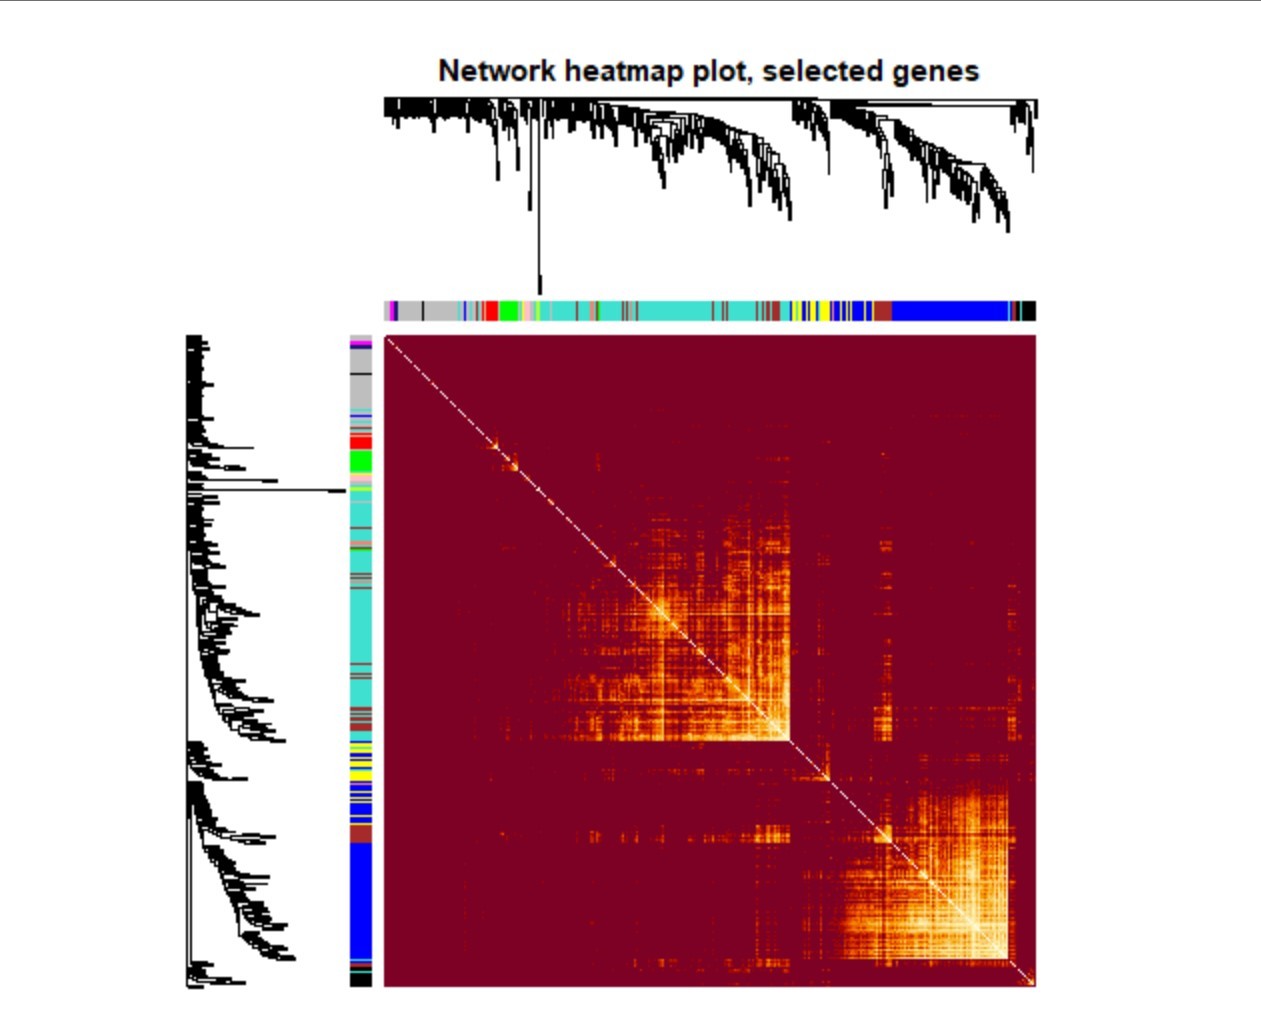
 按照代码跑出来的热图,结果是周围颜色很深,中间很浅,感觉怪怪的样子,不是太懂,能帮忙解释以下原因吗
怀疑是R包更新后,默认颜色不同了,
library(gplots)
myheatcol = colorpanel(250,'red',"orange",'lemonchiffon')
TOMplot(plotTOM, geneTree, moduleColors, main = "Network heatmap plot, all genes", col=myheatcol)
用这个试试,我改了后就可以了,来自
怀疑是R包更新后,默认颜色不同了,
library(gplots) myheatcol = colorpanel(250,'red',"orange",'lemonchiffon') TOMplot(plotTOM, geneTree, moduleColors, main = "Network heatmap plot, all genes", col=myheatcol)
用这个试试,我改了后就可以了,来自
dissTOM = 1-TOMsimilarityFromExpr(datExpr, power = sft$powerEstimate)
plotTOM = dissTOM^7
diag(plotTOM) = NA
TOMplot(plotTOM, geneTree, moduleColors, main = "Network heatmap plot, all genes")
nSelect = 400
set.seed(10);
select = sample(nGenes, size = nSelect);
selectTOM = dissTOM[select, select];
selectTree = hclust(as.dist(selectTOM), method = "average")
selectColors = moduleColors[select]
plotDiss = selectTOM^7;
diag(plotDiss) = NA;
TOMplot(plotDiss, selectTree, selectColors, main = "Network heatmap plot, selected genes")
这是代码文件
