轻松搞定iTOL注释文件
之前给大家推荐了iTOL绘制进化树: 绘一棵超酷炫的系统发育树 和 进化树中如何体现分组。不会使用iTOL的同学可以去看一下这两篇文章,这能够让你很快的学会iTOL基本的使用方法。但是iTOL使用真正的难点在于注释文件的准备,基本都需要手动准备,因此会花费大量的时间,尤其是在配色上,而且最后的成品图通常都不尽如人意。
难道就没有效率更高的方法么?嘿嘿,其实是有的,table2itol就是这条捷径。
table2itol简介
table2itol是在GitHup上公开的R语言包,其作用是专门为iTOL生成所需的注释文件,只需准备表格形式的数据,包含配色方案的注释文件就会自动生成,极大提高了准备注释文件的效率。
table2itol地址:https://github.com/mgoeker/table2itol
table2itol下载安装
对于习惯使用Linux系统的同学,可以这样安装:
wget https://github.com/mgoeker/table2itol/archive/master.zip
unzip master.zip
## 测试
cd table2itol-master
Rscript table2itol.R
chmod +x table2itol.R
./table2itol.R
习惯使用Windows系统的同学,可以这样安装:
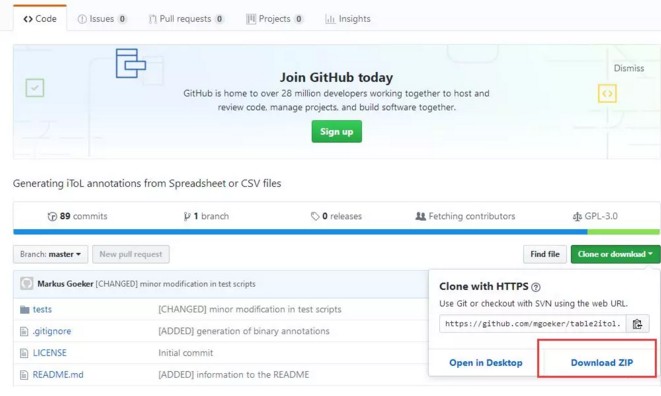
GitHup上直接下载table2itol压缩包,解压后放在 F:\software 文件夹下。在R或Rstudio中导入table2itol.R。
setwd("F:/software/table2itol-master")
source("table2itol.R")
table2itol依赖包安装
table2itol使用需要依赖很多包,如下图所示:
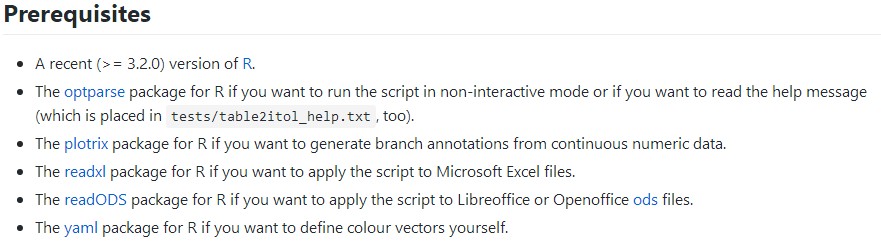
在R或Rstudio中,安装方法如下:
### 安装依赖包
site="https://mirrors.tuna.tsinghua.edu.cn/CRAN"
# 依赖包列表:参数解析、数据变换、绘图和开发包安装、安装依赖、ggplot主题
package_list = c("grid","ggplot2","gridExtra","vegan","reshape2","readODS")
# 判断R包加载是否成功来决定是否安装后再加载
for(p in package_list){
    if(!suppressWarnings(suppressMessages(require(p, character.only = TRUE, quietly = TRUE, warn.conflicts = FALSE)))){
        install.packages(p, repos=site)
        suppressWarnings(suppressMessages(library(p, character.only = TRUE, quietly = TRUE, warn.conflicts = FALSE)))
    }
}
#### 安装缺少的R包
source("http://bioconductor.org/biocLite.R")
biocLite(c("optparse", "plotrix", "readODS", "readxl", "yaml"))
输入文件准备
table2itol的输入文件格式很多,以最常用的表格为例,格式如下:
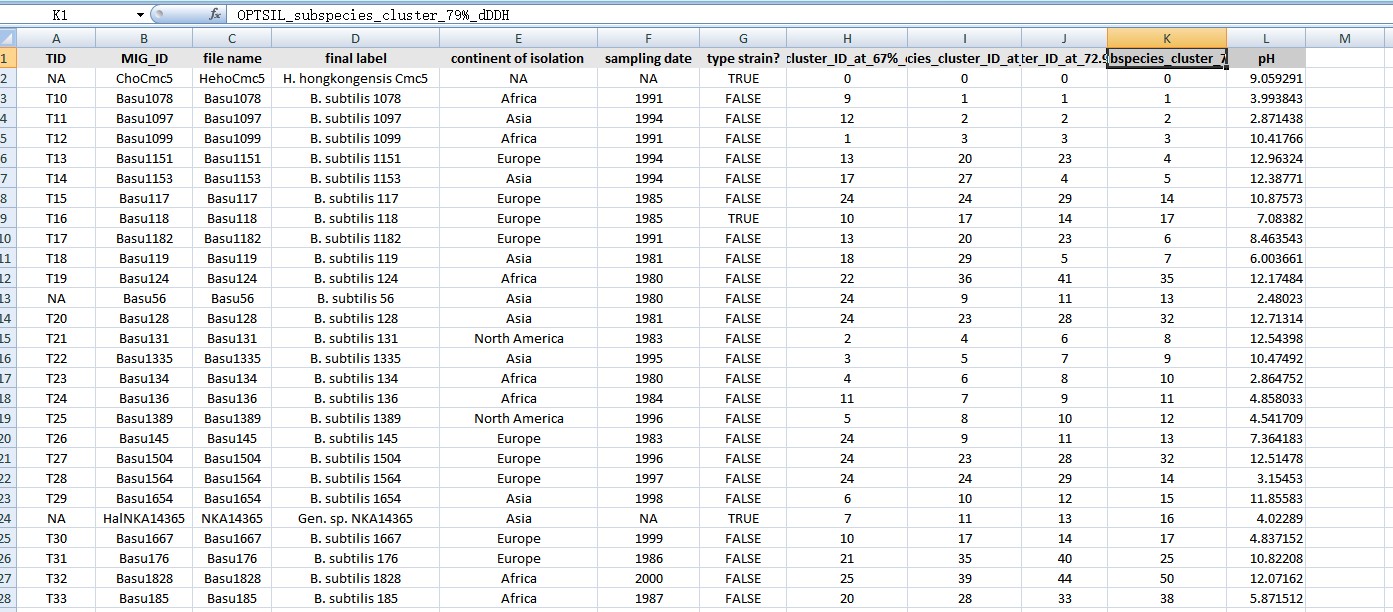
第一行是表头,标注每一列的数据内容,每一列为一组数据。第一列通常是进化树中的叶标签。(图中数据为示例数据example_001.xlsx)
选项设置
table2itol.R的选项有很多,不同选项可生成不同的注释文件,选项列表如下:
Options:
        -a, --abort
                Abort if a requested column cannot be found instead of just skipping the data set [default: FALSE]
        -b NAME, --background=NAME
                Column to define the background colours of the tip labels; empty means no background colours [default: ]
        -c NAME, --conversion=NAME
                Convert integer columns to factors ('factor') or numbers with decimal points ('double') or just not 0/1 to logical vectors ('keep') [default: none]
        -C FILE, --colour-file=FILE
                File in YAML format defining alternative colour vectors for domain output [default: ]
        -d, --double-to-bars
                Create bar charts, not gradients, from numbers with decimal points ('double') [default: FALSE]
        -D DIR, --directory=DIR
                Place output files in this directory ('.' means working directory, empty means input file directory) [default: .]
        -e NAME, --emblems=NAME
                Column to define symbol assignments; ignored if empty [default: ]
        -f NUMBER, --favour=NUMBER
                Numeric factor for favouring colours over symbols (higher => more colours relative to symbols) [default: 1]
        -G FILE, --gradient-file=FILE
                File in YAML format defining alternative colours for gradient and binary output [default: ]
        -h, --help
                Show this help message, then exit [default: FALSE]
        -i NAME, --identifier=NAME
                Mandatory identifier column; after modification as defined by --template this column must yield the tip labels of the tree [default: ID]
        -j NAME, --identifier2=NAME
                Optional 2nd identifier column, causing output of branchsymbols; together with -i this identifies a node [default: ]
        -l NAME, --label=NAME
                Column to define the tip labels displayed in the picture in place of the tip labels found in the tree [default: Label]
        -m INTEGER, --max-size=INTEGER
                Exceeding this threshold causes fewer colours and more symbols to be selected (see also --favour); also determines size of branch symbols [default: 20]
        -n TEXT, --na-strings=TEXT
                Sentinels for missing input values; several can be provided, separated by the value of --separator [default:    (null)  NA]
        -o NUMBER, --opacity=NUMBER
                Numeric factor for the transparency of the colours (0 => transparent, 1 => fully opaque) [default: 1]
        -p INTEGER, --precision=INTEGER
                Number of decimal points used in the gradient legends [default: 1]
        -r TEXT/NUMBER, --restrict=TEXT/NUMBER
                How to select from numeric values that yield branch symbols [default: ]
        -s CHARACTER, --separator=CHARACTER
                Input column separator for CSV-like files [default:     ]
        -t PATTERN, --template=PATTERN
                Template for sprintf function to convert ID column when deviating from tip labels [default: %s]
        -w NUMBER, --width=NUMBER
                Border with used for domains, colour strips etc. [default: 0.5]
也可在解压安装目录下的 table2itol_help.txt 文件或者直接调用帮助信息查看。大家灵活选择使用的选项即可。
生成注释文件
文件准备完成后就需要生成注释文件了,有两种方式生成:一种为linux下命令行运行方式,另一种是在R或Rstudio中运行。
linux下命令行运行:
./table2itol.R --na-strings X --identifier Tip --label Name ann1.tsv ann2.tsv
R或Rstudio中运行:
source("table2itol.R")
create_itol_files(infiles = c("ann1.tsv", "ann2.tsv"),
   identifier = "Tip", label = "Name", na.strings = "X")
做好了注释文件,就可以把它直接拖到iTOL网站进行测试啦!效果图如下:
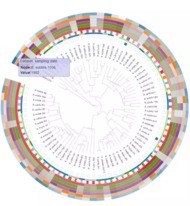
小伙伴儿赶紧去试一试吧。
最后祝您科研愉快!
(图片源于网络,侵删)
- 发表于 2018-12-14 15:21
- 阅读 ( 14669 )
- 分类:R
